Chart of the week: will gold stocks follow the metal lower?
9th August 2021 13:49
by John Burford from interactive investor
Technical analyst John Burford looks at miners of the precious metal in light of the recent slip in its price.

Shares in gold miners have been a pretty disappointing investment over the years.
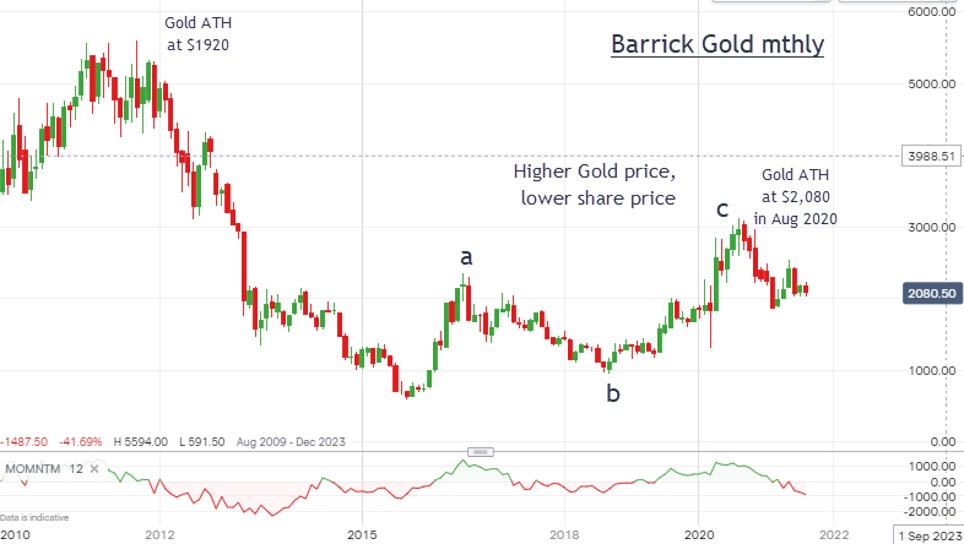
Here is a chart of one of the US big boys, Barrick Gold (NYSE:GOLD), from the famous all-time high (ATH) at $1,920 set in 2011.
The shares then entered a strong bear phase to the 2015 low and then began a recovery as the gold price rose.
Past performance is not a guide to future performance.
But at the year-ago gold ATH at $2,080, the shares did not make an ATH to take advantage of the high gold price but only managed a recovery to a Fibonacci 50% retrace of the entire bear run from 2011 to 2015 (to my 'c' wave high).
With the gold price exceeding that in 2011, why did the shares not make a more substantial recovery?
Projecting a share price from that of the metal is complicated because of varying hedging (selling forward) policies used by the miners.
Some may have hedged heavily before a gold rally phase – and miss out on the higher prices - and some may not have hedged at all.
You can see that company earnings are highly dependent on the hedging policy!
Whatever the reason for the poor performance, it indicates pretty clearly that rallies would likely be limited and that there is a bias towards an overall bear trend.
And with the form of the advance off the 2015 low appearing as a three up (a-b-c, which is corrective), it seems the major trend remains down.
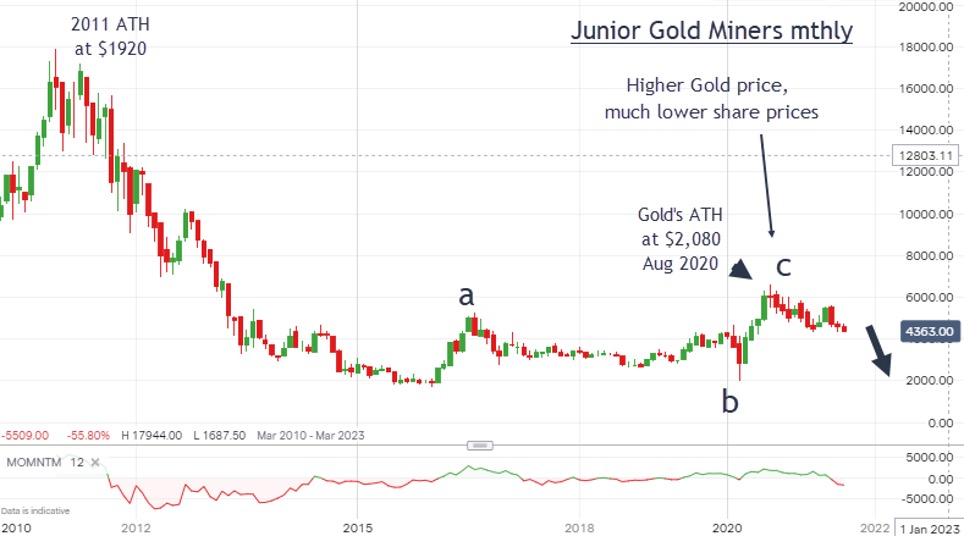
And the position is even more bearish for the junior gold miners. This is the VanEck Vectors™ Junior Gold Miners ETF GBP (LSE:GJGB) ETF in the same period:
Past performance is not a guide to future performance.
The form of the waves is identical but this time, the rally has only reached a 30% retrace of the 2011–2015 slide compared with a 50% retrace for Barrick.
The big question is this: if gold mining shares cannot rally substantially when the metal is making new ATHs, what would it take to fire them up?
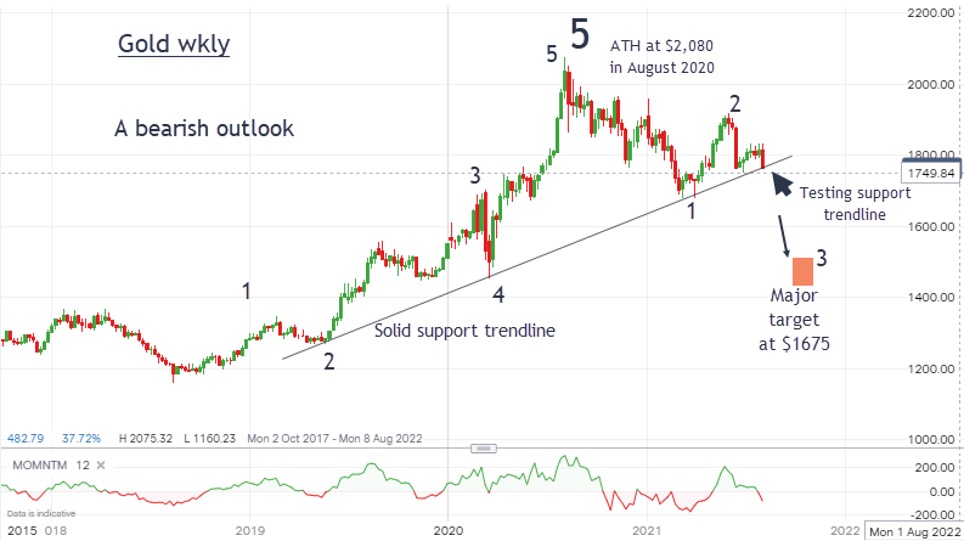
Here is the gold chart:
Past performance is not a guide to future performance.
I have the final fifth wave at the August 2020 ATH at $2,080 and the first decline is wave 1 of what should turn out to be a five-wave bear trend.
That wave 1 terminated right at the major support trendline and the rally to the wave 2 high was a perfectly textbook Fibonacci 62% retrace of wave 1.
And last week's selling brought the market right back down to test the support trendline. I believe the trend is now down and only an unlikely surge above the wave 2 high at $1,830 would send me back to my drawing board.
My first major target is at the $1,675 area (latest trade $1,760). Mining shares are likely to follow.
STOP PRESS: this morning (9 August), gold has met my first target at $1,675.
John Burford is the author of the definitive text on his trading method, Tramline Trading. He is also a freelance contributor and not a direct employee of interactive investor.
These articles are provided for information purposes only. Occasionally, an opinion about whether to buy or sell a specific investment may be provided by third parties. The content is not intended to be a personal recommendation to buy or sell any financial instrument or product, or to adopt any investment strategy as it is not provided based on an assessment of your investing knowledge and experience, your financial situation or your investment objectives. The value of your investments, and the income derived from them, may go down as well as up. You may not get back all the money that you invest. The investments referred to in this article may not be suitable for all investors, and if in doubt, an investor should seek advice from a qualified investment adviser.
Full performance can be found on the company or index summary page on the interactive investor website. Simply click on the company's or index name highlighted in the article.
Disclosure
We use a combination of fundamental and technical analysis in forming our view as to the valuation and prospects of an investment. Where relevant we have set out those particular matters we think are important in the above article, but further detail can be found here.
Please note that our article on this investment should not be considered to be a regular publication.
Details of all recommendations issued by ii during the previous 12-month period can be found here.
ii adheres to a strict code of conduct. Contributors may hold shares or have other interests in companies included in these portfolios, which could create a conflict of interests. Contributors intending to write about any financial instruments in which they have an interest are required to disclose such interest to ii and in the article itself. ii will at all times consider whether such interest impairs the objectivity of the recommendation.
In addition, individuals involved in the production of investment articles are subject to a personal account dealing restriction, which prevents them from placing a transaction in the specified instrument(s) for a period before and for five working days after such publication. This is to avoid personal interests conflicting with the interests of the recipients of those investment articles.