Commodities: Can gold and oil rallies continue?
After making big profits in recent weeks, our markets analyst gives his view on these resource trades.
26th June 2019 11:48
by Rajan Dhall from interactive investor
After making big profits in recent weeks, our markets analyst gives his view on these resource trades.

Miners like Centamin (LSE:CEY) and Fresnillo (LSE:FRES) have been on the move this week as gold continues to rack up big gains. The precious metal has burst through six-year highs to trade up at as much as $1,439 per ounce in the spot contract.
This move comes as central banks around the world shift stance to insinuate they may become more accommodative. Fixed income yields have plunged, stocks have shot up and safe haven flows flocked to gold as a result.
The move higher in stocks still comes amid a period of great uncertainty, with the G20 summit taking place in Japan this week. Analysts think this could be why gold might pull away from highs, believing that any deal between the US and China will encourage stock markets. Either way, heading into the weekend we could be in for some volatility.
A technical analyst's gold forecast
In the weekly gold futures chart below I have highlighted some key levels. In the short-term, a deal between Xi and Trump may trigger a pullback for gold to previous resistance - now support - at $1,377.5. This currently seems the most likely scenario.
On the topside, if a deal is not reached and the proverbial can is kicked down the road, then $1,523 per ounce could come into play longer term. This level was a formidable support zone back in 2012-13 after the great gold bull run.
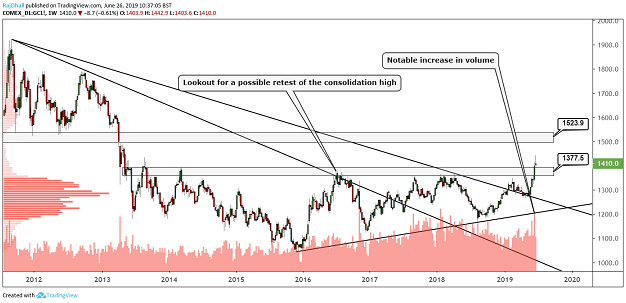
Source: TradingView Past performance is not a guide to future performance
Where's the oil price heading next?
Oil markets have also been on the rise this week following developments in the Middle East and a surprising drawdown in US oil stockpiles. Government officials in Tehran said the White House is "afflicted by mental disability" after the Trump administration launched fresh sanctions on the country's leadership.
Since last week's attack on two oil tankers in the Strait of Hormuz, the war of words has escalated and neither side is showing any sign of backing down. These days, war is increasingly done via cyber-attacks and drone missions, so the imminent threat of an all-out invasion of Iran remains low. But with "the Donald" in charge, who knows?
Latest figures from the American Petroleum Institute (API), for the week-ended 21 June, showed inventory levels down 7.5 million barrels on the week before to 474.5 million barrels. Markets had expected a smaller decline to 2.5 million barrels. Today, energy traders are watching Department of Energy (DoE) figures, due for release at 3.30pm London time, for confirmation of the trend, plus the usual production numbers.
From a technical perspective, the charts have been playing out excellently. Crude prices stalled exactly at the level identified in last week’s report and are now starting to look toppy, unless we have another fundamental catalyst for a move higher.
If we see a build in storage levels or a miss on in today's DoE figures, we could see a move lower toward the $57.49 per barrel support zone. That said, on a longer-term horizon, Middle East issues may persist, providing ample opportunity for support.
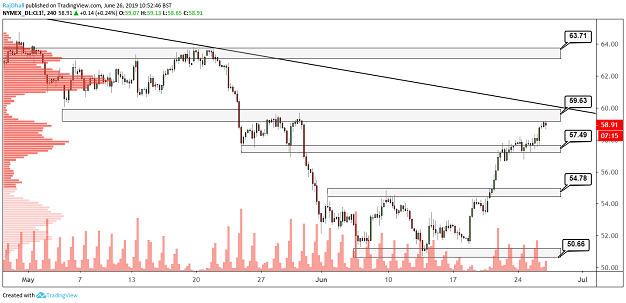
Source: TradingView Past performance is not a guide to future performance
Rajan Dhall is a freelance contributor and not a direct employee of interactive investor.
These articles are provided for information purposes only. Occasionally, an opinion about whether to buy or sell a specific investment may be provided by third parties. The content is not intended to be a personal recommendation to buy or sell any financial instrument or product, or to adopt any investment strategy as it is not provided based on an assessment of your investing knowledge and experience, your financial situation or your investment objectives. The value of your investments, and the income derived from them, may go down as well as up. You may not get back all the money that you invest. The investments referred to in this article may not be suitable for all investors, and if in doubt, an investor should seek advice from a qualified investment adviser.
Full performance can be found on the company or index summary page on the interactive investor website. Simply click on the company's or index name highlighted in the article.