Commodities outlook: It's all action as Fed decides
Central bank policymakers are influencing financial markets. Here's how they may impact commodities.
19th June 2019 14:10
by Rajan Dhall from interactive investor
Central bank policymakers are influencing financial markets. Here's how they may impact commodities.

There is lots going on in the world of commodities at the moment, but it all starts with macroeconomics.
Just yesterday, the European Central Bank (ECB) president Mario Draghi hinted that the ECB may look at a rate cut to stimulate the slowing economy in the EU. Expectations for both eurozone inflation and growth have recently been downgraded - inflation expectations have reached their lowest levels on record.
As such, markets priced in a rate cut as soon as July, while some expect the ECB to act later in the year.
Straight off the bat, both copper and oil rose in anticipation that looser monetary policy could mean a boost to the economy. Later in the session, Donald Trump had his say. Taking to Twitter, the US president said Draghi was just using his power to devalue the euro against the dollar.
Commodities markets then received even more good news as Trump confessed that talks with China are reopening. Global stock markets shifted sharply higher along with industrial commodities.
Today, we get the latest from US rate-setters at the Federal Reserve. Financial markets expect a dovish Fed Chair Jerome Powell following the recent slowdown in US inflation, and at least one rate cut this year is being priced in.
Trump has been piling the pressure on, accusing the Fed of not doing enough to boost the US economy. If it was up to him, we would probably get a rate cut and some stimulus today!
Oil price action
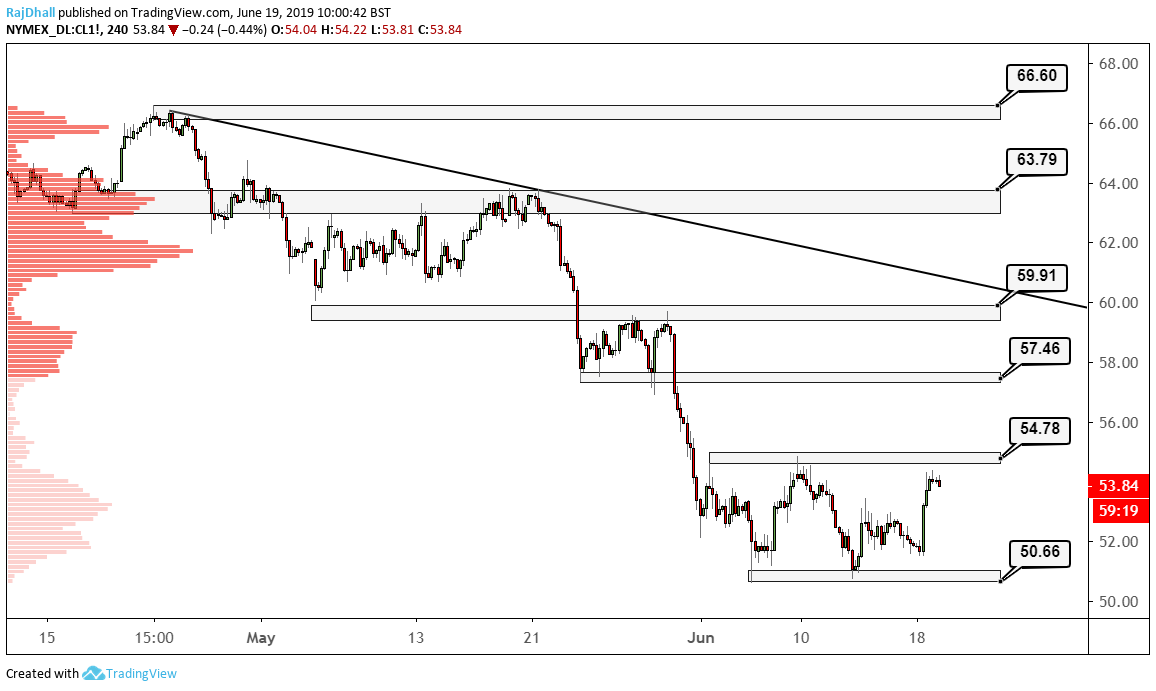
On the four-hour chart below, a base formation has taken shape, and any break above $54.78 per barrel will indicate more bullish momentum.
Russian Energy Minister Alexander Novak indicated recently that Russia will be at the next OPEC meeting. If they manage to agree deeper production cuts, the oil price could find the inspiration to break key levels to higher ground. An extension to the current 1.2 million barrels per day cut may not be enough for oil bulls, though.
On the lower end, $50.66 per barrel remains key support, and a visit here will show the resumption of the bearish trend.

Source: TradingView Past performance is not a guide to future performance
Optimistic about copper?
Copper is also sitting pretty today, but the Fed could throw a spanner in the works. If we see dollar strength off the back of the Fed not being as dovish as the market expects, some of the strength in base metal prices could reverse.
On the plus side, the strike over at the Codelco mine in Chile is still on and it seems a resolution remains some way off.
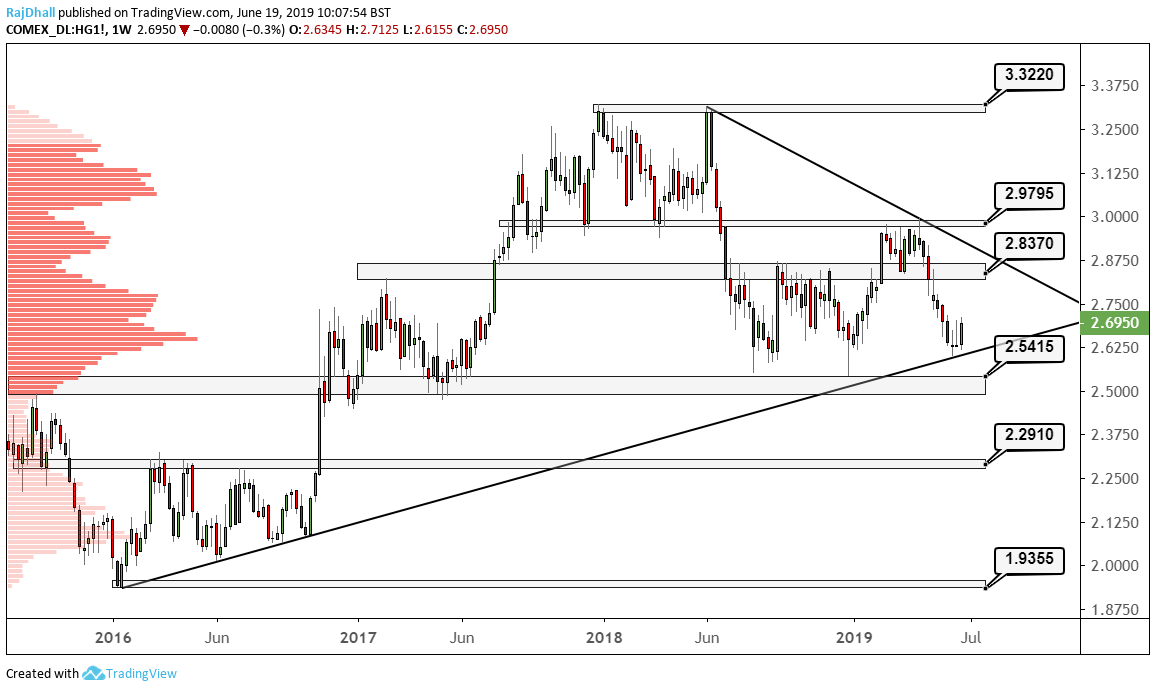
On the weekly chart below, there was a nice rejection off the upward sloping trendline. Now, if the dollar falls, the price could be headed to the $2.83 per pound resistance level. This, however, is also very much dependent on how the US-China trade talks work out, so keep an eye on the newswires.

Source: TradingView Past performance is not a guide to future performance
Rajan Dhall is a freelance contributor and not a direct employee of interactive investor.
These articles are provided for information purposes only. Occasionally, an opinion about whether to buy or sell a specific investment may be provided by third parties. The content is not intended to be a personal recommendation to buy or sell any financial instrument or product, or to adopt any investment strategy as it is not provided based on an assessment of your investing knowledge and experience, your financial situation or your investment objectives. The value of your investments, and the income derived from them, may go down as well as up. You may not get back all the money that you invest. The investments referred to in this article may not be suitable for all investors, and if in doubt, an investor should seek advice from a qualified investment adviser.
Full performance can be found on the company or index summary page on the interactive investor website. Simply click on the company's or index name highlighted in the article.