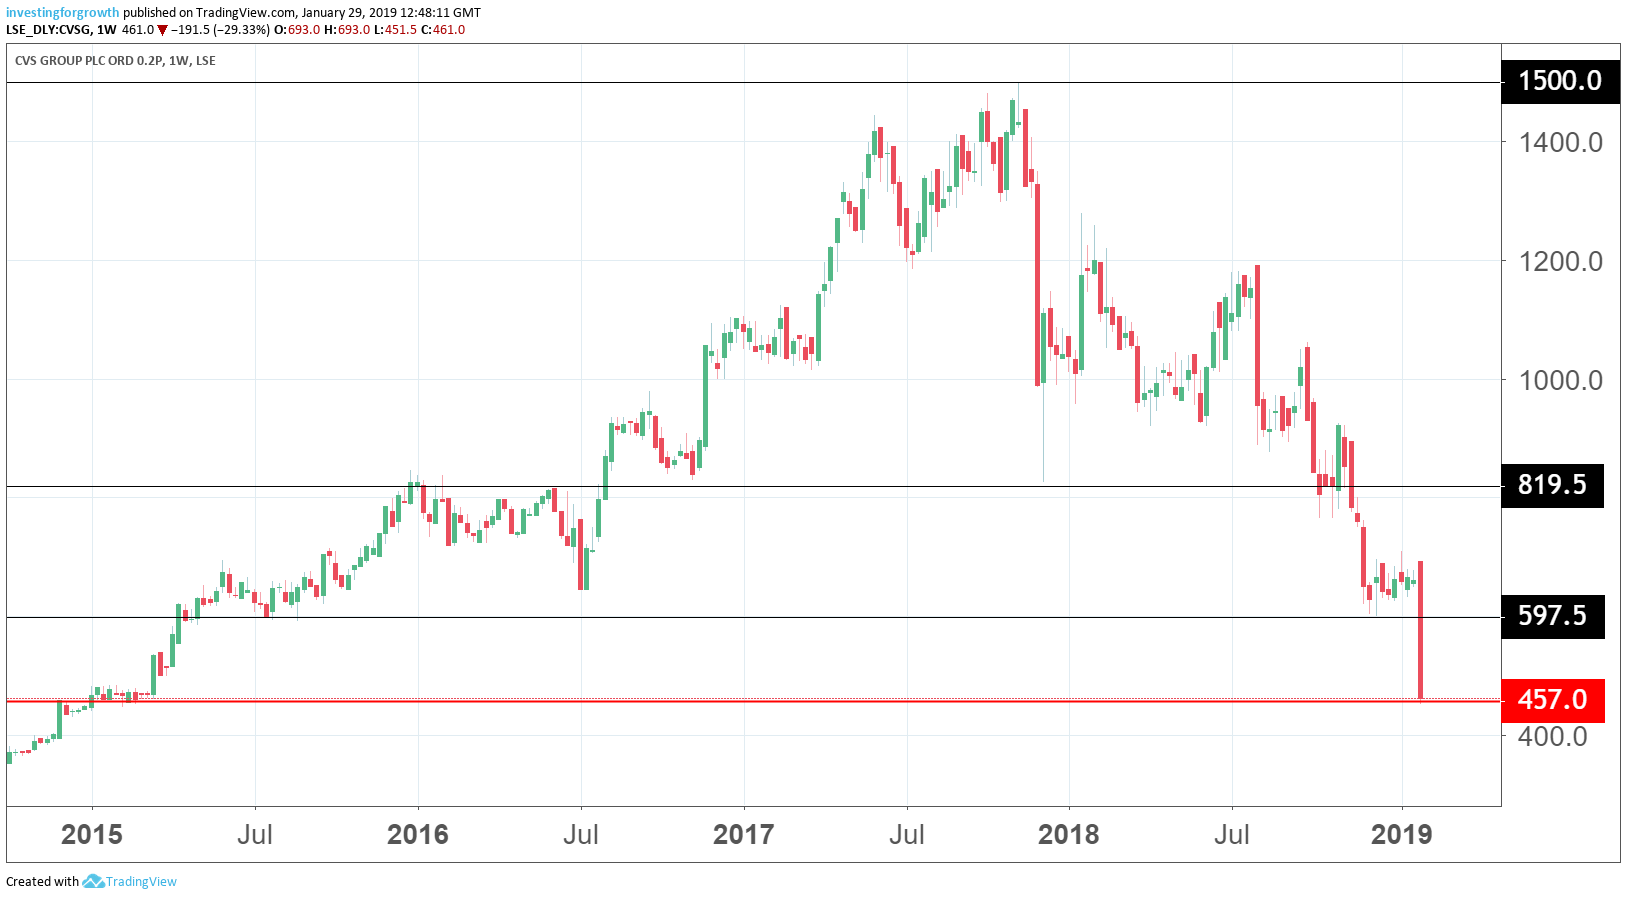
CVS Group friendless after collapsing 30%
29th January 2019 12:57
by Graeme Evans from interactive investor
After their latest dive, shares in this former AIM darling are down 66% in just 15 months. But what now?

As one of the fastest-moving shares on AIM, veterinary services group CVS Group (LSE:CVSG) was once setting investor pulses racing in the same way as Fevertree Drinks (LSE:FEVR) or Boohoo Group (LSE:BOO).
So good was its performance that CVS picked up Company of the Year in the 2015 AIM Awards — when Fevertree went home with the gong for best newcomer.
CVS's classic high-growth performance, driven by a steady stream of acquisitions in order to consolidate a fragmented market, meant shares jumped more than 700% from the start of 2013 to their peak of 1,500p in October 2017.
It's been downhill ever since, with today's slide of almost 30% the latest share price setback from a business that now boasts more than 500 sites in the UK, Ireland and the Netherlands. Its 6,000-strong headcount includes over 1,500 vets and 2,000 nurses.
In today's update, CVS warned that underlying earnings were likely to be materially below current market forecasts, reflecting a disappointing performance from its newer divisions covering Farm and Equine.
But CVS's problems run deeper, however, as it continues to struggle with the continuing industry-wide shortage of vets caused by Brexit uncertainty. With the company seeing a significant rise in the market rates for locum cover, this has meant that employment costs for the first half of the financial year are running well above last year.

Source: TradingView weekly chart (*) Past performance is not a guide to future performance
The acquisition taps have also dried up, with the multiples being sought by vet practice owners now too rich for CVS to achieve acceptable returns. Three practices were bought for a combined £5 million in the first week of December, but none since then.
Having tapped the City for £58.9 million in a fundraising last February, the company is re-evaluating all acquisitions and "particularly the multiples it is willing to pay".
Subsequent to that share placing at 1,075p. CVS spent £55 million on acquisitions up until September as part of 52 surgeries added in the 2018 financial year. The placing also helped to reduce debt, although this is now up to £116 million in today's update. CVS said it remained comfortably within its covenants and continues to generate cash.
The recent share price slide backs the judgment of our analyst Edmond Jackson, who told readers the company was one to avoid when shares were 1,094p shortly after the share placing last February.
He noted that CVS's biggest financial driver was exploiting a valuation gap on which it can acquire vet practices — in recent years, on about 8 times annual cash flow. Without acquisitions, he also questioned the company's ability to deliver anywhere near the growth rates investors look for.
Jackson wrote: "Call me cautious, but I think all this adds up to investors reckoning CVS shares have had their best run. If the UK economy doesn't weaken, then spending on pets and further acquisitions may prop up the show, but the market will see through this if like-for-like trading remains stalled."
Its sales figures in today's update were resilient, with like-for-likes up 4% in the first half of the financial year. Including new surgeries, the total increased by 23.7%.
Gross margins were recorded at 76.2%, but that's down from 79.5% in 2018 thanks to an increased mix of Farm business. Sales from this division now account for 8.9% of sales, compared with 3.2% previously.
In its newer divisions, CVS blamed a lack of support from pharmaceutical companies as it continues to push for "transparent and appropriate pricing".
As well as its surgeries, CVS offers many other services providing various cross-selling opportunities. This includes four laboratories, seven pet crematoria, two buying groups, an online business and MiPet Insurance. There's also a preventative healthcare programmes with over 385,000 members.
*Horizontal lines on charts represent levels of previous technical support and resistance. Trendlines are marked in red.
These articles are provided for information purposes only. Occasionally, an opinion about whether to buy or sell a specific investment may be provided by third parties. The content is not intended to be a personal recommendation to buy or sell any financial instrument or product, or to adopt any investment strategy as it is not provided based on an assessment of your investing knowledge and experience, your financial situation or your investment objectives. The value of your investments, and the income derived from them, may go down as well as up. You may not get back all the money that you invest. The investments referred to in this article may not be suitable for all investors, and if in doubt, an investor should seek advice from a qualified investment adviser.
Full performance can be found on the company or index summary page on the interactive investor website. Simply click on the company's or index name highlighted in the article.