eyeQ: AstraZeneca shares and a tactical entry point
interactive investor has teamed up with experts at eyeQ who use artificial intelligence and their own smart machine to generate actionable trading signals. Their model currently shows AstraZeneca could be about to get interesting.
7th February 2024 10:04
by Huw Roberts from eyeQ

"Our signals are crafted through macro-valuation, trend analysis, and meticulous back-testing. This combination ensures a comprehensive evaluation of an asset's value, market conditions, and historical performance." eyeQ
Discover: eyeQ analysis explained | eyeQ: our smart machine in action | Glossary
AstraZeneca
Trading signal: strategic long-term
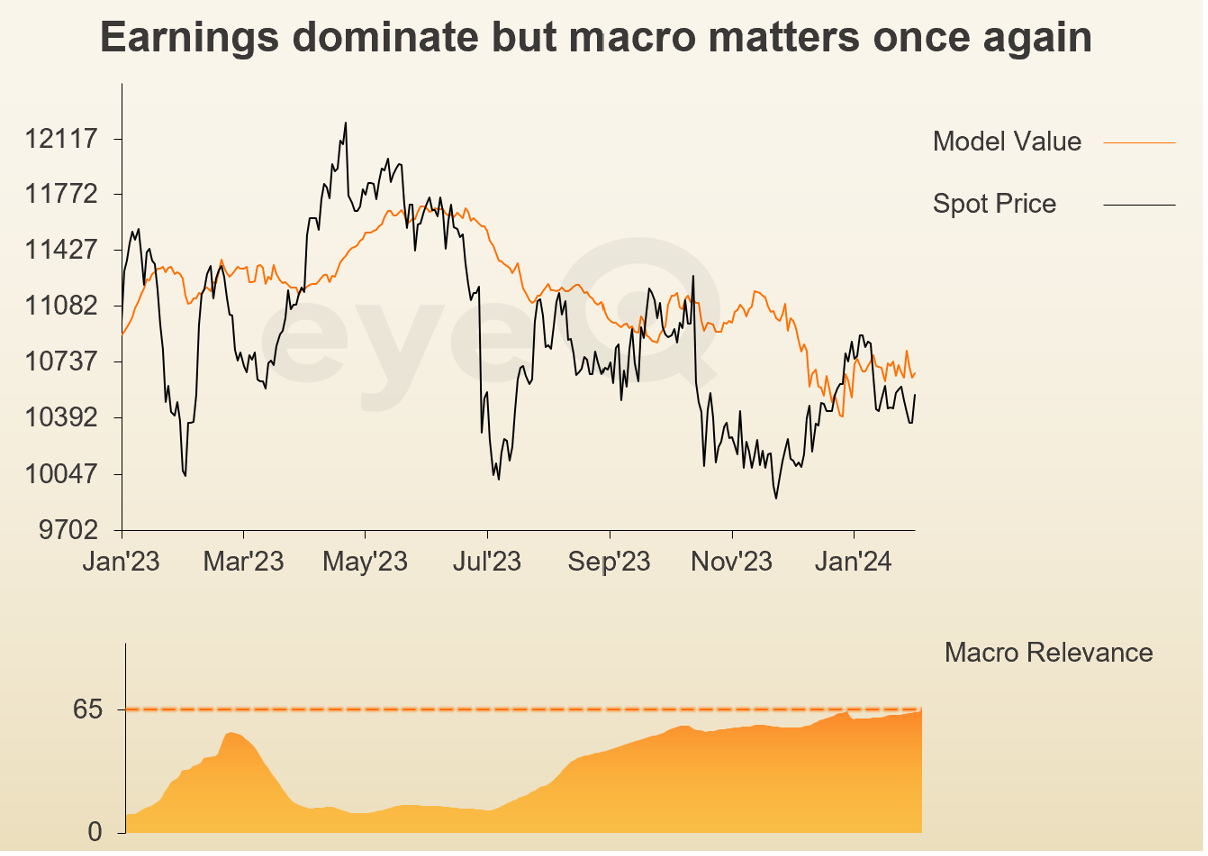
Model value:10,759.71p
Fair Value Gap (premium/discount to Model Value): -2.7%
Model relevance: 66%
Data correct as at 7 February 2024. Please click glossary for explanation of terms.
AstraZeneca (LSE:AZN) reports its full-year and fourth-quarter results on Thursday, but let's not fixate solely on results. Macro conditions are back in the spotlight.
For the last year, eyeQ’s macro relevance figure for Astra has been low – this tells investors that company news mattered more than macro conditions.
But now macro relevance is at 66% - when relevance is above 65% our research suggests the stock is being driven by macro factors.
Put another way, investors can no longer focus exclusively on company fundamentals – they need to be aware of the big picture stuff like economic growth, inflation, the Bank of England etc.
So, what is the macro perspective?
Despite the recent sell-off, model value held steady through January, leaving AstraZeneca 2.7% undervalued in macro terms, according to our smart machine. While not a massive Fair Value Gap, it's approaching interesting levels.
In fact, our smart machine shows that when our Astra shares fall more than 4% below eyeQ model value, we have ourselves an efficient signal.
Since 2009 there have been 41 occasions when the pharmaceutical company has had high macro relevance and been that cheap on our models. So, crudely, such an opportunity occurs nearly three times a year.
And using that level as a buy-the-dip signal has an 86% hit rate. That simply means 8.6 times out of 10, the signal made money. On average it took four weeks to make 3.4%.
We’re not there yet but one to watch. Should earnings disappoint and prompt a sell-off, then we could see a tactical entry point.
Useful terminology:
Model value
Where our smart machine calculates that any stock market index, singe stock or exchange-traded fund (ETF) should be priced (the fair value) given the overall macroeconomic environment.
Model (macro) relevance
How confident we are in the model value. The higher the number the better! Above 65% means the macro environment is critical, so any valuation signals carry strong weight. Below 65%, we deem that something other than macro is driving the price.
Fair Value Gap (FVG)
The difference between our model value (fair value) and where the price currently is. A positive Fair Value Gap means the security is above the model value, which we refer to as “rich”. A negative FVG means that it's cheap. The bigger the FVG, the bigger the dislocation and therefore a better entry level for trades.
Long Term model
The Long Term model looks at share prices over the last 12 months, captures the company’s relationship with growth, inflation, currency shifts, central bank policy etc and calculates our key results - model value, model relevance, Fair Value Gap.
These third-party research articles are provided by eyeQ (Quant Insight). interactive investor does not make any representation as to the completeness, accuracy or timeliness of the information provided, nor do we accept any liability for any losses, costs, liabilities or expenses that may arise directly or indirectly from your use of, or reliance on, the information (except where we have acted negligently, fraudulently or in wilful default in relation to the production or distribution of the information).
The value of your investments may go down as well as up. You may not get back all the money that you invest.
Equity research is provided for information purposes only. Neither eyeQ (Quant Insight) nor interactive investor have considered your personal circumstances, and the information provided should not be considered a personal recommendation. If you are in any doubt as to the action you should take, please consult an authorised financial adviser.
Disclosure
We use a combination of fundamental and technical analysis in forming our view as to the valuation and prospects of an investment. Where relevant we have set out those particular matters we think are important in the above article, but further detail can be found here.
Please note that our article on this investment should not be considered to be a regular publication.
Details of all recommendations issued by ii during the previous 12-month period can be found here.
ii adheres to a strict code of conduct. Contributors may hold shares or have other interests in companies included in these portfolios, which could create a conflict of interests. Contributors intending to write about any financial instruments in which they have an interest are required to disclose such interest to ii and in the article itself. ii will at all times consider whether such interest impairs the objectivity of the recommendation.
In addition, individuals involved in the production of investment articles are subject to a personal account dealing restriction, which prevents them from placing a transaction in the specified instrument(s) for a period before and for five working days after such publication. This is to avoid personal interests conflicting with the interests of the recipients of those investment articles.