eyeQ: the bulls look firmly in control in this sector
Experts at eyeQ have used AI and their own smart machine to analyse macro conditions and generate actionable trading signals. Here’s what it makes of this impressive turnaround.
25th June 2025 11:19
by Huw Roberts from eyeQ

“Our signals are crafted through macro-valuation, trend analysis, and meticulous back-testing. This combination ensures a comprehensive evaluation of an asset's value, market conditions, and historical performance.” eyeQ
- Discover: eyeQ analysis explained | eyeQ: our smart machine in action | Glossary
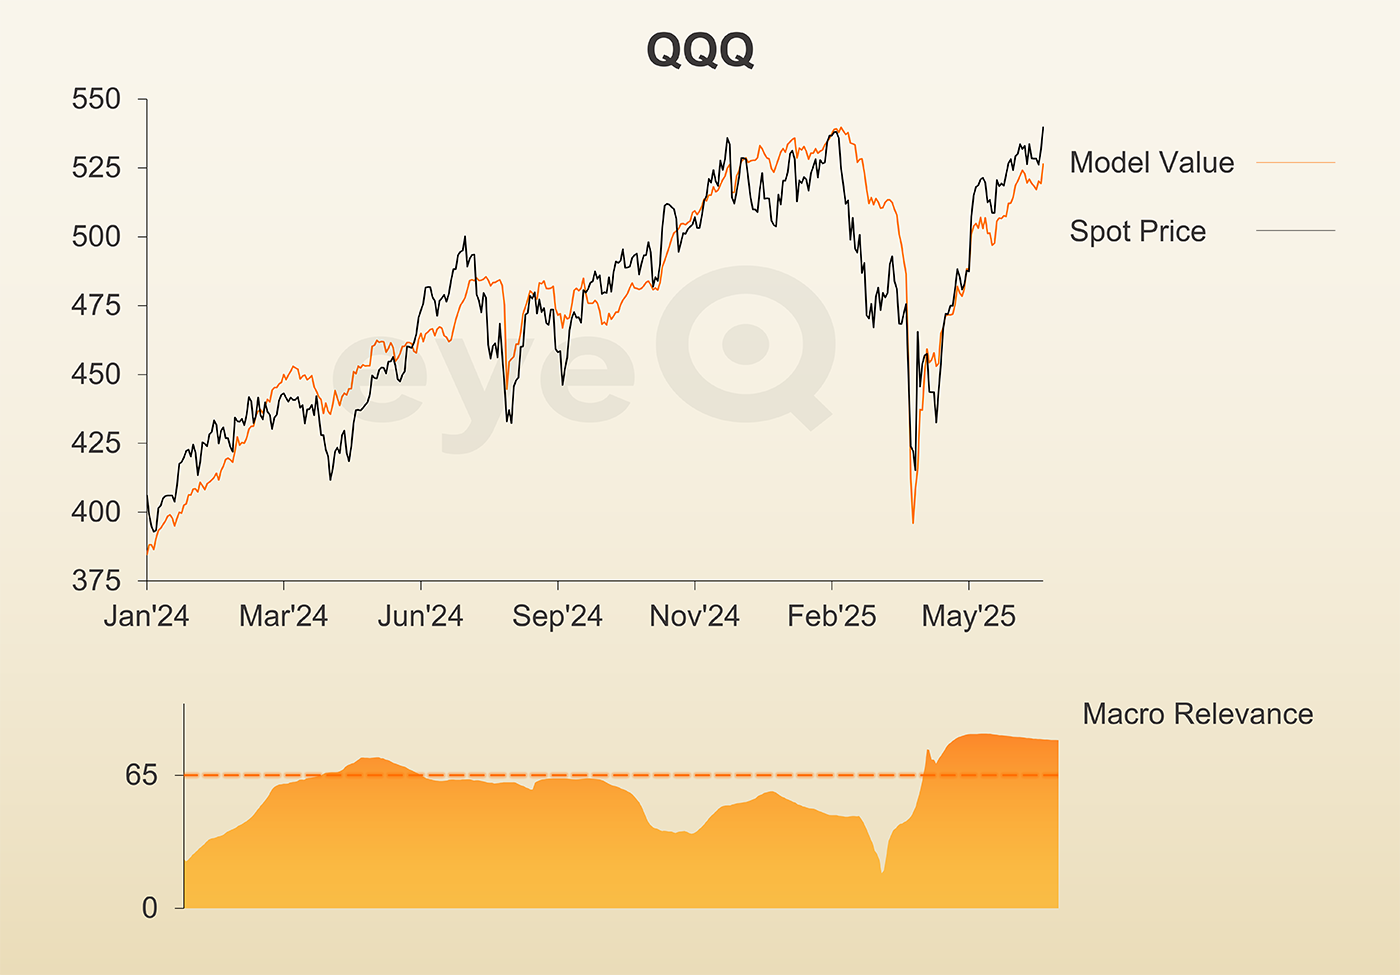
Invesco QQQ Trust
Macro Relevance: 82%
Model Value: $526.35
Fair Value Gap: +2.49% premium to model value
Data correct as at 25 June 2025. Please click glossary for explanation of terms. Long-term strategic model.
This Nasdaq exchange-traded fund (ETF) has just hit another all-time high.
Fears around a global trade war prompted a 23% fall back in April, so the speed of the turnaround is mighty impressive. In fact, that's the third-fastest recovery in US tech stocks since 1990 - only the 1998 correction and Covid sell-off unwound faster.
The charting perspective would be that this is a positive development. It implies the bears quickly capitulated, and that the bulls are firmly in control. Expect lots of talk about melt-ups to follow.
What's the macro perspective?
A macro relevance score of 82% means big-picture stuff such as growth, inflation and the Federal Reserve are important.
But for several months at the end of 2024 and start of 2025 macro wasn't a key driver. That helps explain why eyeQ model value tended to lag the spot price of Invesco QQQ Trust (NASDAQ:QQQ), the ETF that tracks the Nasdaq tech index.
The current macro regime has been in place since April and, in that time, macro conditions have been improving - model value has risen 7.1% since 1 April.
This latest acceleration higher has taken QQQ 2.5% above eyeQ model value. That's not a big valuation gap in the big scheme of things. It would need to effectively double before the elastic was stretched too thin and flashed a bearish signal.
So, for now, while these aren't the ideal entry levels from the macro viewpoint, there's little to argue against the charts and the picture from technical analysis.
Source: eyeQ. Past performance is not a guide to future performance.
Useful terminology:
Model value
Where our smart machine calculates that any stock market index, single stock or exchange-traded fund (ETF) should be priced (the fair value) given the overall macroeconomic environment.
Model (macro) relevance
How confident we are in the model value. The higher the number the better! Above 65% means the macro environment is critical, so any valuation signals carry strong weight. Below 65%, we deem that something other than macro is driving the price.
Fair Value Gap (FVG)
The difference between our model value (fair value) and where the price currently is. A positive Fair Value Gap means the security is above the model value, which we refer to as “rich”. A negative FVG means that it's cheap. The bigger the FVG, the bigger the dislocation and therefore a better entry level for trades.
Long Term model
This model looks at share prices over the last 12 months, captures the company’s relationship with growth, inflation, currency shifts, central bank policy etc and calculates our key results - model value, model relevance, Fair Value Gap.
These third-party research articles are provided by eyeQ (Quant Insight). interactive investor does not make any representation as to the completeness, accuracy or timeliness of the information provided, nor do we accept any liability for any losses, costs, liabilities or expenses that may arise directly or indirectly from your use of, or reliance on, the information (except where we have acted negligently, fraudulently or in wilful default in relation to the production or distribution of the information).
The value of your investments may go down as well as up. You may not get back all the money that you invest.
Equity research is provided for information purposes only. Neither eyeQ (Quant Insight) nor interactive investor have considered your personal circumstances, and the information provided should not be considered a personal recommendation. If you are in any doubt as to the action you should take, please consult an authorised financial adviser.
Disclosure
We use a combination of fundamental and technical analysis in forming our view as to the valuation and prospects of an investment. Where relevant we have set out those particular matters we think are important in the above article, but further detail can be found here.
Please note that our article on this investment should not be considered to be a regular publication.
Details of all recommendations issued by ii during the previous 12-month period can be found here.
ii adheres to a strict code of conduct. Contributors may hold shares or have other interests in companies included in these portfolios, which could create a conflict of interests. Contributors intending to write about any financial instruments in which they have an interest are required to disclose such interest to ii and in the article itself. ii will at all times consider whether such interest impairs the objectivity of the recommendation.
In addition, individuals involved in the production of investment articles are subject to a personal account dealing restriction, which prevents them from placing a transaction in the specified instrument(s) for a period before and for five working days after such publication. This is to avoid personal interests conflicting with the interests of the recipients of those investment articles.