eyeQ: is this star stock picker’s fund a buy?
Experts at eyeQ have used AI and their own smart machine to analyse macro conditions and generate actionable trading signals. Here, it considers a fund for those still bullish on US tech.
1st May 2025 11:15
by Huw Roberts from eyeQ

“Our signals are crafted through macro-valuation, trend analysis, and meticulous back-testing. This combination ensures a comprehensive evaluation of an asset's value, market conditions, and historical performance.” eyeQ
- Discover: eyeQ analysis explained | eyeQ: our smart machine in action | Glossary
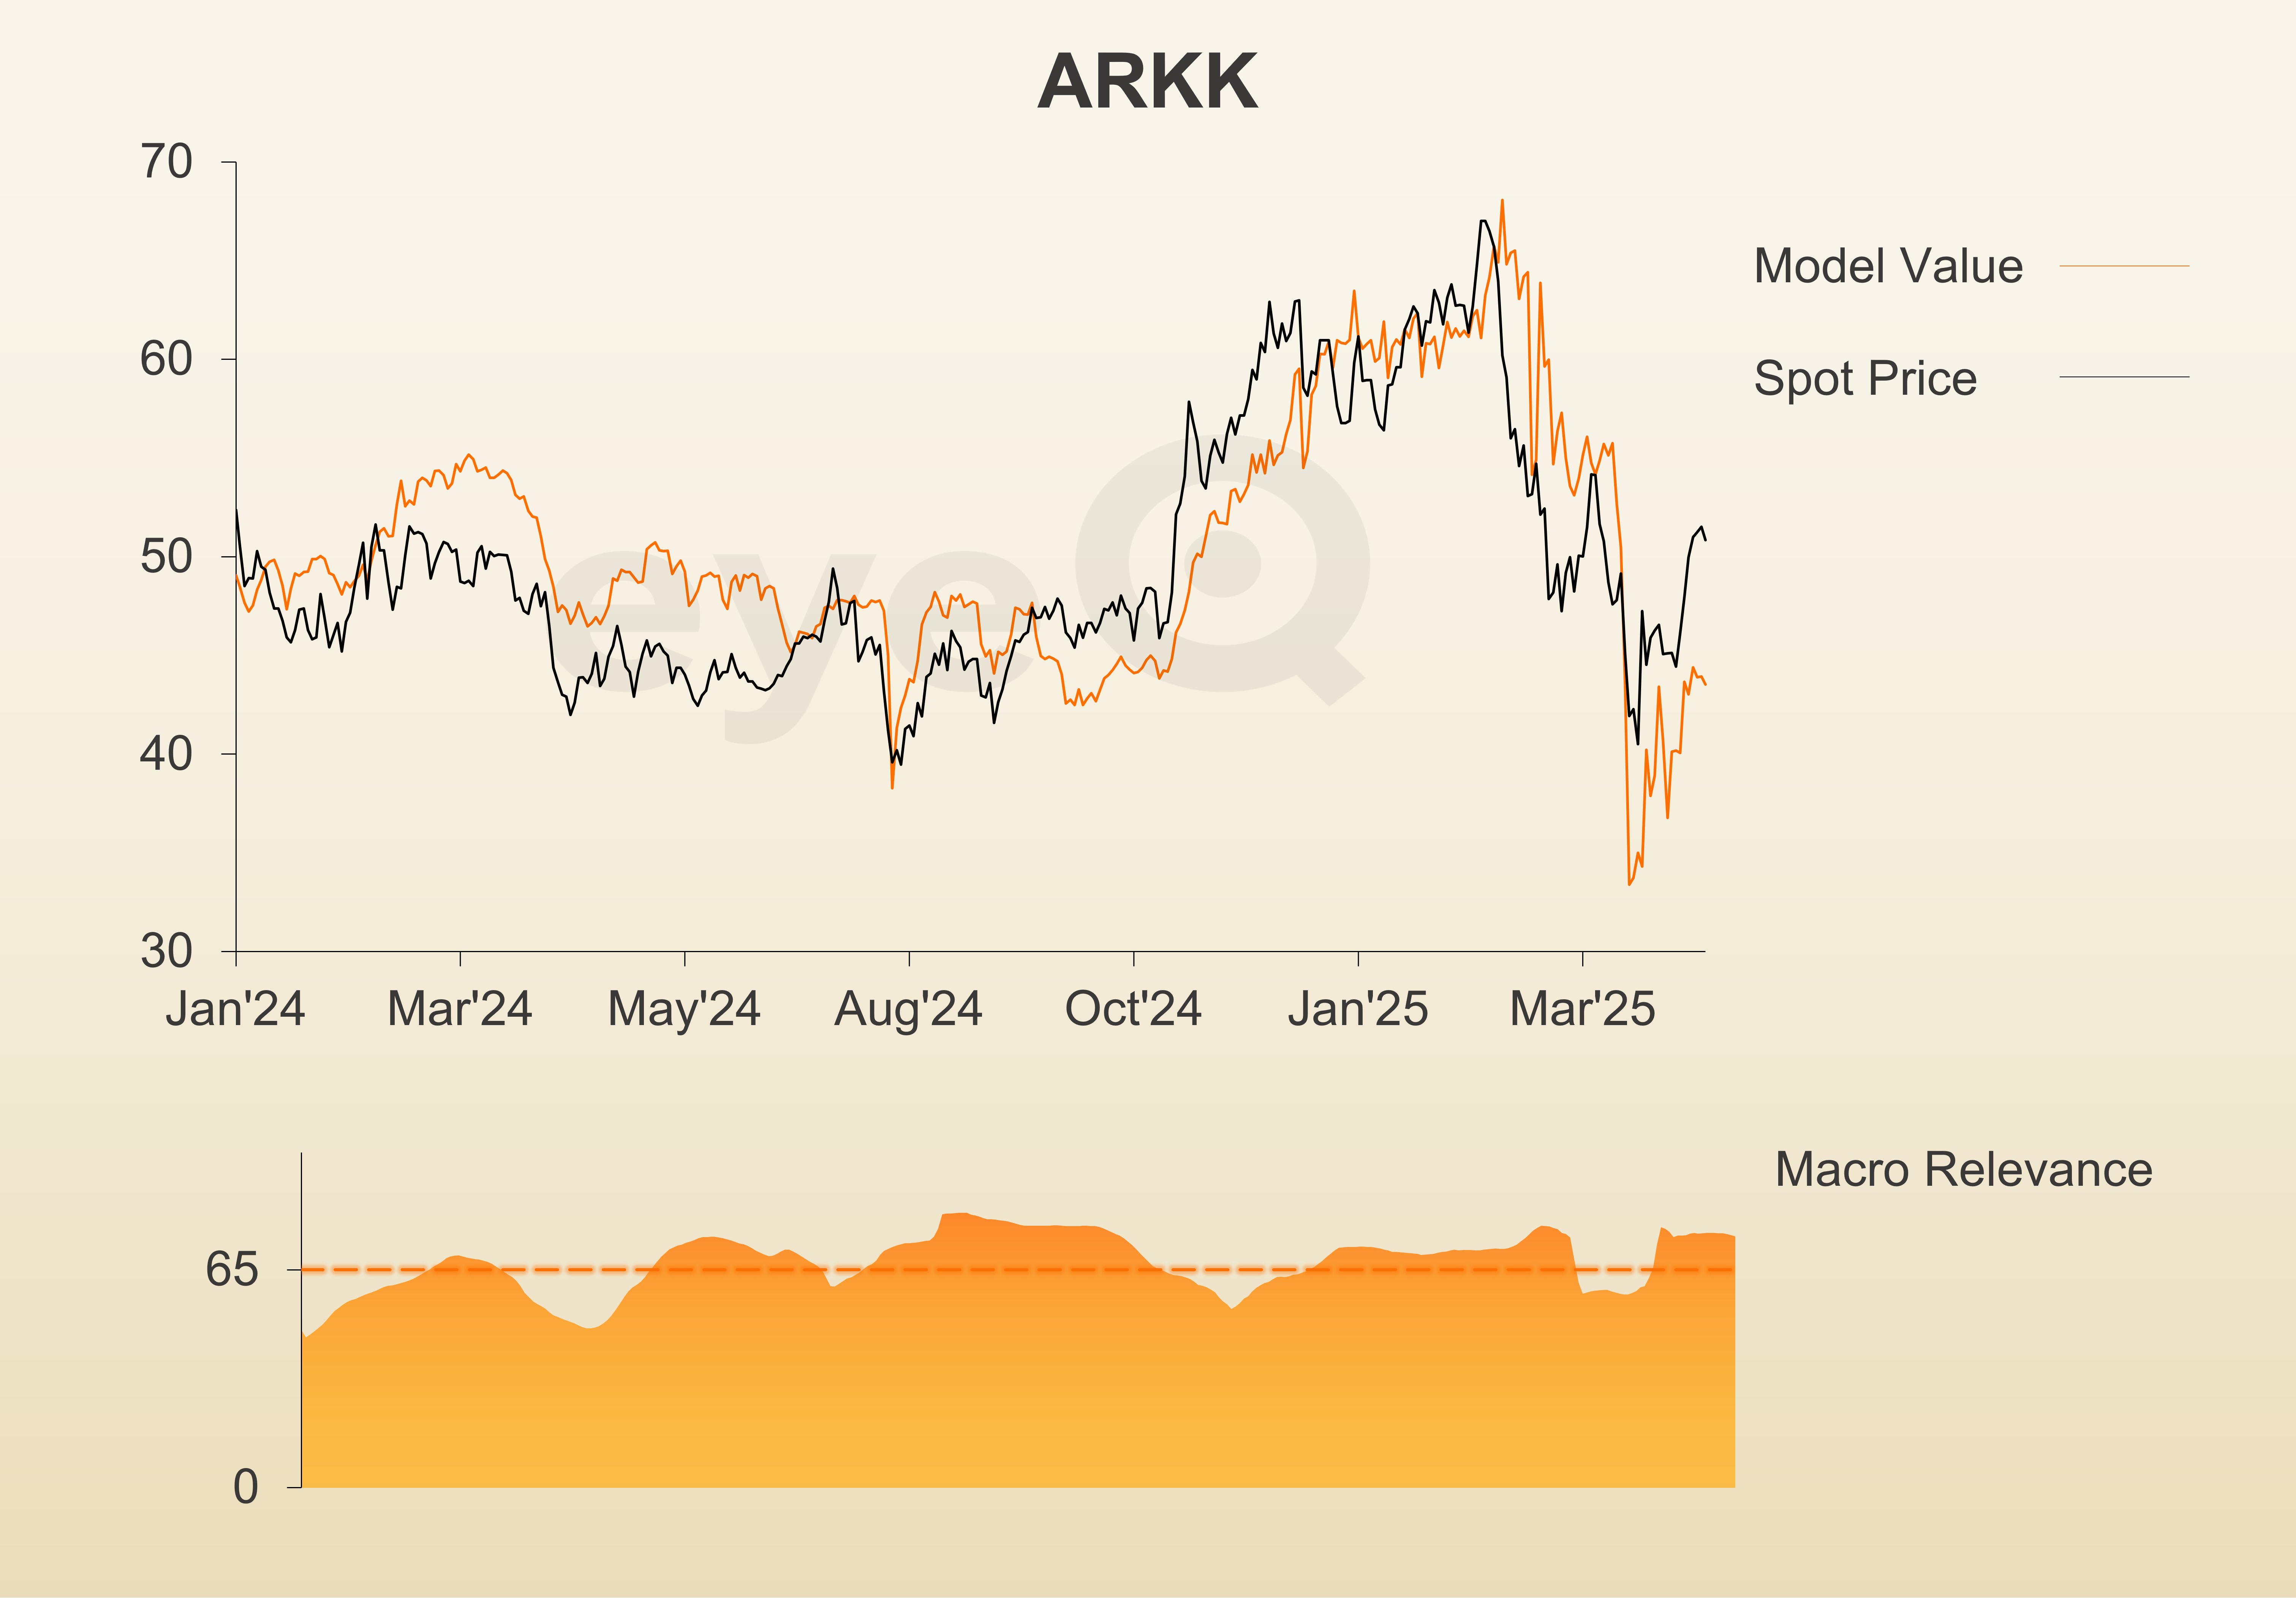
ARK Innovation ETF*
Macro Relevance: 75%
Model Value: $43.54
Fair Value Gap: +14.37% premium to model value
Data correct as at 1 May 2025. Please click glossary for explanation of terms. Long-term strategic model. *Data is for the US-listed ETF only. You can find the UK version here: ARK Innovation ETF A USD Acc (LSE:ARKK)
eyeQ’s model for ARK Innovation ETF A USD Acc (LSE:ARKK) suggests the exchange-traded fund (ETF) should be trading around $43.54. It sits over 14% north of there right now, which is a big enough valuation gap to trigger a bearish signal.
Like many of its peers, the first half of April was brutal for Cathie Woods’ thematic fund, which provides exposure to disruptive innovation. But US equities staged an impressive bounce-back over the second half of the month.
Given the latest leg of that move has been fuelled by strong earnings from Microsoft Corp (NASDAQ:MSFT) and Meta Platforms Inc Class A (NASDAQ:META), it’s no surprise that an ETF that aims to identify the Magnificent Seven stocks of the future has also rallied hard. But this move has now overshot the broad macro environment.
It is notable that ARKK’s macro regime (which has strong explanatory power) wants a return to the days when US exceptionalism prevailed - reflation, easy money and a strong dollar.
eyeQ model value has stopped rising, which could just be a pause for breath or it could signify that macro conditions are losing a little momentum. Either way, these don’t look great levels to chase.
Even if you are bullish US tech, the risk-reward suggests you should wait for better entry levels.
Source: eyeQ. Past performance is not a guide to future performance.
Useful terminology:
Model value
Where our smart machine calculates that any stock market index, single stock or exchange-traded fund (ETF) should be priced (the fair value) given the overall macroeconomic environment.
Model (macro) relevance
How confident we are in the model value. The higher the number the better! Above 65% means the macro environment is critical, so any valuation signals carry strong weight. Below 65%, we deem that something other than macro is driving the price.
Fair Value Gap (FVG)
The difference between our model value (fair value) and where the price currently is. A positive Fair Value Gap means the security is above the model value, which we refer to as “rich”. A negative FVG means that it's cheap. The bigger the FVG, the bigger the dislocation and therefore a better entry level for trades.
Long Term model
This model looks at share prices over the last 12 months, captures the company’s relationship with growth, inflation, currency shifts, central bank policy etc and calculates our key results - model value, model relevance, Fair Value Gap.
These third-party research articles are provided by eyeQ (Quant Insight). interactive investor does not make any representation as to the completeness, accuracy or timeliness of the information provided, nor do we accept any liability for any losses, costs, liabilities or expenses that may arise directly or indirectly from your use of, or reliance on, the information (except where we have acted negligently, fraudulently or in wilful default in relation to the production or distribution of the information).
The value of your investments may go down as well as up. You may not get back all the money that you invest.
Equity research is provided for information purposes only. Neither eyeQ (Quant Insight) nor interactive investor have considered your personal circumstances, and the information provided should not be considered a personal recommendation. If you are in any doubt as to the action you should take, please consult an authorised financial adviser.
Disclosure
We use a combination of fundamental and technical analysis in forming our view as to the valuation and prospects of an investment. Where relevant we have set out those particular matters we think are important in the above article, but further detail can be found here.
Please note that our article on this investment should not be considered to be a regular publication.
Details of all recommendations issued by ii during the previous 12-month period can be found here.
ii adheres to a strict code of conduct. Contributors may hold shares or have other interests in companies included in these portfolios, which could create a conflict of interests. Contributors intending to write about any financial instruments in which they have an interest are required to disclose such interest to ii and in the article itself. ii will at all times consider whether such interest impairs the objectivity of the recommendation.
In addition, individuals involved in the production of investment articles are subject to a personal account dealing restriction, which prevents them from placing a transaction in the specified instrument(s) for a period before and for five working days after such publication. This is to avoid personal interests conflicting with the interests of the recipients of those investment articles.