FTSE for Friday: is this key trend about to break?
4th March 2022 07:30
by Alistair Strang from Trends and Targets
With stock markets lurching lower again, independent analyst gives his latest view of what the future might bring for the FTSE 100 index.
Our doom laden outlook against Wall Street yesterday appeared to strike a few chords, so we guess quite a few folk want to know how bad things could get for the FTSE 100 too, if everything starts to go (even more) horribly wrong with the world. To judge by the number of shares needing updated daily, volatility is currently the name of the game, so perhaps it shall not prove silly to run the numbers against a Big Picture reversal risk.
There is a detail worthy of attention currently. It appears that if we pencil in a trend line since October 2020, the UK stock market has carefully adhered to this Red line, needing to close today below 7,228 points to indicate the trend failing. However, if the market intends to continue its game of chicken with this historic uptrend, there appears a chance today should experience some gains.
- Why reading charts can help you become a better investor
- Friends & Family: ii customers can give up to 5 people a free subscription to ii, for just £5 a month extra. Learn more
In fact, if we opt to play safe, below 7,204 (the previous two lows) looks like singing a song of misery, capable of provoking a reversal cycle to an initial 7,095 with secondary, if broken, at 6,897 points.
This secondary target is an issue, taking the FTSE marginally below the uptrend since the pandemic low of 2020 and this risks being a serious Red Flag, ensuring the UK is trading in a zone where “bottom” risks being discovered down around 6,000 points.
However, it’s important to remember despite an awful week, calamity has not been triggered yet and we’re essentially just playing with numeric potentials.
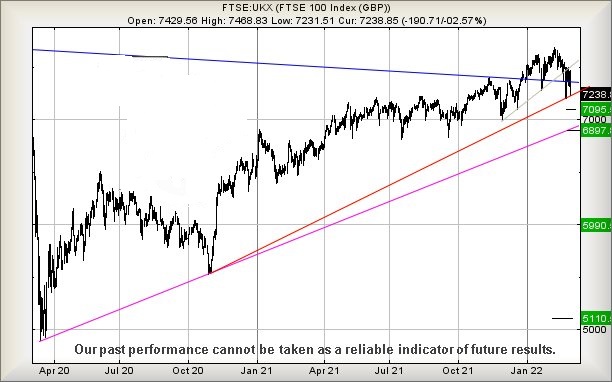
Source: Trends and Targets. Past performance is not a guide to future performance
As for the FTSE near term, as opposed to the above Big Picture, there’s a bit of an argument anticipating some FTSE gains. At present, the UK index needs trade above 7,280 to suggest a gap upward at the open should be treated with respect.
Such a trigger level allegedly allows for gains toward an initial 7,322 points. If bettered, our secondary calculation brings 7,380 to the table. The tightest stop looks wide at 7,230 points.
- Could the S&P 500 really fall 20%
- When markets fall heavily, here's what to avoid doing
- FTSE 100 reshuffle: Ukraine conflict will likely cause these changes
Our converse reversal scenario suggests near term movement below 7,230 risks promoting reversal to an initial 7,161 points. If broken, our secondary works out at 7,107 points.
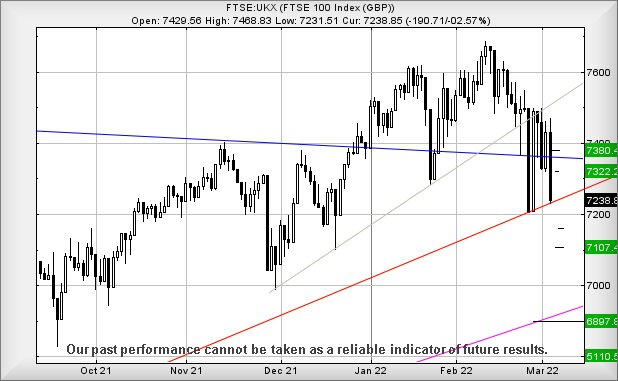
Source: Trends and Targets. Past performance is not a guide to future performance
Alistair Strang has led high-profile and "top secret" software projects since the late 1970s and won the original John Logie Baird Award for inventors and innovators. After the financial crash, he wanted to know "how it worked" with a view to mimicking existing trading formulas and predicting what was coming next. His results speak for themselves as he continually refines the methodology.
Alistair Strang is a freelance contributor and not a direct employee of Interactive Investor. All correspondence is with Alistair Strang, who for these purposes is deemed a third-party supplier. Buying, selling and investing in shares is not without risk. Market and company movement will affect your performance and you may get back less than you invest. Neither Alistair Strang or Interactive Investor will be responsible for any losses that may be incurred as a result of following a trading idea.
These articles are provided for information purposes only. Occasionally, an opinion about whether to buy or sell a specific investment may be provided by third parties. The content is not intended to be a personal recommendation to buy or sell any financial instrument or product, or to adopt any investment strategy as it is not provided based on an assessment of your investing knowledge and experience, your financial situation or your investment objectives. The value of your investments, and the income derived from them, may go down as well as up. You may not get back all the money that you invest. The investments referred to in this article may not be suitable for all investors, and if in doubt, an investor should seek advice from a qualified investment adviser.
Full performance can be found on the company or index summary page on the interactive investor website. Simply click on the company's or index name highlighted in the article.