This heavily-traded energy stock could have impressive headroom
Multiple arguments favour price recovery, though there are no guarantees.
19th May 2021 08:53
by Alistair Strang from Trends and Targets
Multiple arguments favour price recovery, though there are no guarantees.

E.On SE
Our weekly trip to discover which shares are being most heavily traded in Europe brought energy stock E.On (XE:EOAN) to our attention.
A glance at its corporate website revealed a pretty thorough checklist of all the current right-on terms. It mentions diversity, hydrogen, fuel cells, digital, sustainability and of course innovation. The word ‘profitable’ was also mentioned once, a daring departure from the norm. Most corporate entities seem to prefer a web presence where dangerous trigger words like 'profit' are avoided!
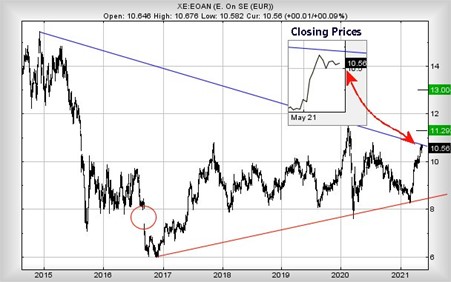
Presently trading around €10.50 (£9.05), the share price is starting to show some interesting potentials despite spending most of May trapped in the arms of boring.
The price need only rise above €10.80 for a trip toward an initial €11.29 to look pretty assured.
For some surprising reason, we've multiple calculations all pointing at such an ambition and the story doesn't actually end there.
Our secondary calculation, should €11.29 be exceeded, works out at €13. In fact, it may even be €13.40, thanks to the circled gap on the chart tossing a spanner in the works.
- Ceres Power and the new clean tech boom
- Top 10 most-purchased ETFs in April 2021
- Why reading charts can help you become a better investor
Yet again, something surprising occurs with this secondary ambition as yet again, we've multiple arguments favouring price recovery to such a level. For this sort of thing to occur once, when reviewing a share price, is pretty unusual and generally indicates a comfortable ‘no-brainer’ expectation of movement to a target level.
We've never experienced this twice, against the same share, both from big picture and near-term calculations. Time will tell, as we've no idea what the numbers are telling us...
We started this piece by complaining that the company’s share price has been pretty boring during May, and the reason appears to be the blue line on the chart.
If we zoom out, viewing the big picture since 2014, considerable effort is being made (currently) to inhibit E.On from exploring above this level (see the inset). As a result, anything now above €10.80 is liable to promote fairly fast and strong price recovery.

Alistair Strang has led high-profile and "top secret" software projects since the late 1970s and won the original John Logie Baird Award for inventors and innovators. After the financial crash, he wanted to know "how it worked" with a view to mimicking existing trading formulas and predicting what was coming next. His results speak for themselves as he continually refines the methodology.
Alistair Strang is a freelance contributor and not a direct employee of Interactive Investor. All correspondence is with Alistair Strang, who for these purposes is deemed a third-party supplier. Buying, selling and investing in shares is not without risk. Market and company movement will affect your performance and you may get back less than you invest. Neither Alistair Strang or Interactive Investor will be responsible for any losses that may be incurred as a result of following a trading idea.
These articles are provided for information purposes only. Occasionally, an opinion about whether to buy or sell a specific investment may be provided by third parties. The content is not intended to be a personal recommendation to buy or sell any financial instrument or product, or to adopt any investment strategy as it is not provided based on an assessment of your investing knowledge and experience, your financial situation or your investment objectives. The value of your investments, and the income derived from them, may go down as well as up. You may not get back all the money that you invest. The investments referred to in this article may not be suitable for all investors, and if in doubt, an investor should seek advice from a qualified investment adviser.
Full performance can be found on the company or index summary page on the interactive investor website. Simply click on the company's or index name highlighted in the article.