How gold could make a big comeback
Already up 14% since the summer, our financial markets analyst thinks this could push gold much higher.
31st January 2019 12:42
by Rajan Dhall from interactive investor
Already up 14% since the summer, our financial markets analyst thinks this could push gold much higher.

The price of gold has been climbing nicely in 2019 following recent weakness in the US dollar and stock market confusion over the Christmas period.
Overnight, the price of gold hit $1,323 an ounce, an increase of around 14% since August last year. The whole world knew it was time to start unwinding the balance sheets of the central banks, but it seems only the Federal Reserve was willing to commit.
Currently, the Fed is rolling off $50 billion a month which is a fair amount of the $4.5 trillion used to prop up the markets in the first place. At the moment, there is the small matter of $4 trillion left. It seems amazing that the market is so sensitive about the pace slowing when there is so much left to drain out of the system.
With bond yields suppressed and stock markets artificially inflated higher, gold took a beating as risk turned positive. Now the market is in limbo about what to do with stocks at lofty levels based on printed money. If we unwind, chances are that gold should move up, but that would be too easy wouldn't it?
Elsewhere, Bloomberg reported that global gold demand rose 4% to 4,345.1 tonnes as central banks purchased the most yellow metal since the US severed the dollar's peg to bullion in 1971 in a bid to diversify holdings amid global political issues.
Miners are also worried about expanding operations for the same reasons which points to a demand versus supply increase.
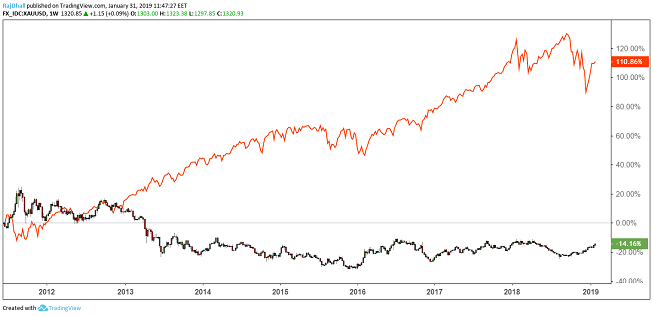
Source: TradingView Past performance is not a guide to future performance
This chart shows the price of gold (black line on chart above) versus the S&P 500 index (orange line) since mid-2011. There is a clear divergence between the two as the stock market rally took off.
But focusing more on more recent events, since late 2018 you can see the convergence kicking in, with gold rising while the stock market sold off over Christmas. While it’s improbable they will come back together any time soon, this is at least an indication that the market was expecting the US to reign in the easy money.
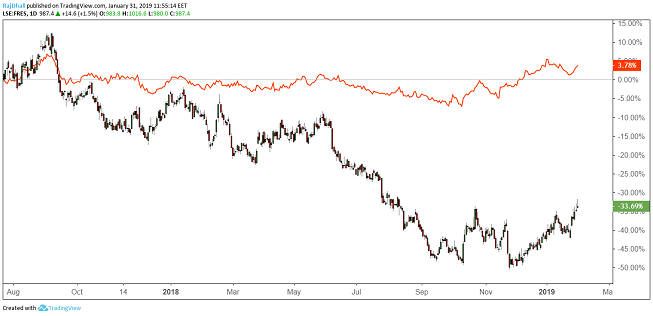
Source: TradingView Past performance is not a guide to future performance
This is a daily chart of Fresnillo (LSE:FRES) (candlesticks on chart above) versus a Physical Gold ETF of gold (LSE:PHGP) in orange, and you can see they are both ticking higher nicely. There are some key levels, but Fresnillo has just taken out a previous wave to make the first higher low and higher high in a while.
Since Barrick (NYSE:GOLD) and Randgold merged, their share price is also looking similar which could indicate further upside as we head into earnings season and as margins increase.
There are a few factors at play here, including uncertainty about when the Fed will stop quantitative tightening (QT), so there is a risk that gold may fall back again.
President Trump's ego is always a threat, too. If the stock market turns sharply there is nothing to prevent another round of easing. However, if QT continues, gold could make a comeback.
These articles are provided for information purposes only. Occasionally, an opinion about whether to buy or sell a specific investment may be provided by third parties. The content is not intended to be a personal recommendation to buy or sell any financial instrument or product, or to adopt any investment strategy as it is not provided based on an assessment of your investing knowledge and experience, your financial situation or your investment objectives. The value of your investments, and the income derived from them, may go down as well as up. You may not get back all the money that you invest. The investments referred to in this article may not be suitable for all investors, and if in doubt, an investor should seek advice from a qualified investment adviser.
Full performance can be found on the company or index summary page on the interactive investor website. Simply click on the company's or index name highlighted in the article.