ii Private Investor Performance Index: Q1 2023
12th April 2023 09:38
by Jemma Jackson from interactive investor
The rise of the over-30s: new trends emerge at the end of the first quarter, says interactive investor.

- Average customer up 2.4% in Q1, with 35-44 age group up the most (2.7%)
- 35-44 year old age group also topping the tables over ii’s longest time period
- Six months performance sees average customer performance up 7.1%
- 65+ cohort down the least over the past difficult year
- Women outperforming men over ii’s longest time period, and down less over the past year
Q1 2023 has been a roller-coaster ride in the stock market, with a series of FTSE 100 record highs giving way to market jitters, catalysed by the collapse of Silicon Valley Bank.
- Invest with ii: Open a Stocks & Shares ISA | What is a Stocks & Shares ISA? | ISA Offers & Cashback
Yet private investors managed to close Q1 in positive territory, with the average* ii customer, as measured by the ii Private Investor Performance Index, up 2.4% in median terms.
This was in line with professional investors, as measured by the IA Mixed Investment 40-85% shares sector (up 2.3%), which can be a useful comparator with private investor portfolios, with its mix of bonds, cash and equities.
Over each time frame recorded, ii customers have either levelled with or beaten the IA Mixed Investment 40-85% shares sector benchmark.
Over the longest period of time charted (3 years 3 months, when ii started collating the data), customers have performed in line with professional managers (up 7.9% versus 7.8% for the IA Mixed Investment 40-85% shares sector ).
Richard Wilson, CEO, interactive investor, says: “Private investors have had to navigate some extraordinary twists and turns over the past few years. This index won’t always make comfortable reading, and nor should it, given the inevitable ups and downs in markets.
“What emerges from our data, over an uncertain period by any measure, is the importance of holding your nerve, staying invested, and having a well-diversified portfolio – never as easy as it sounds.
“Our latest data has seen the 35-44 age group top the customer performance tables over the longer term. This group tends to have a higher exposure to passives and US stocks, but other segments are holding their own too, using different – but not necessarily better or worse, strategies.”
New trends emerge at the end of Q1
Historically, it is interactive investor’s youngest and oldest customers who have tended to hog the top of the performance tables, but Q1 has marked a shift.
Customers in the 35-44 age group have come to the fore, leading performance in Q1 (up 2.7% versus 2.4% overall). This age group are also up the most over ii’s longest time frame of over 3 years 3 months, up 9.8% versus 7.9% overall.
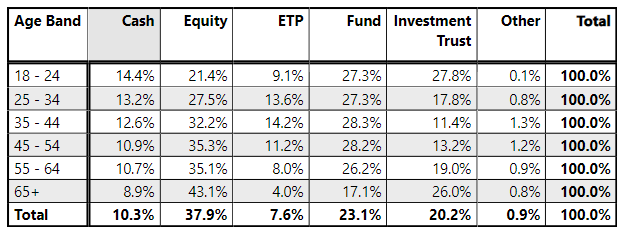
The 35-44 age group has the highest (almost double) exposure to passive Exchange Traded Products (14.2% versus 7.6% for the wider customer base).
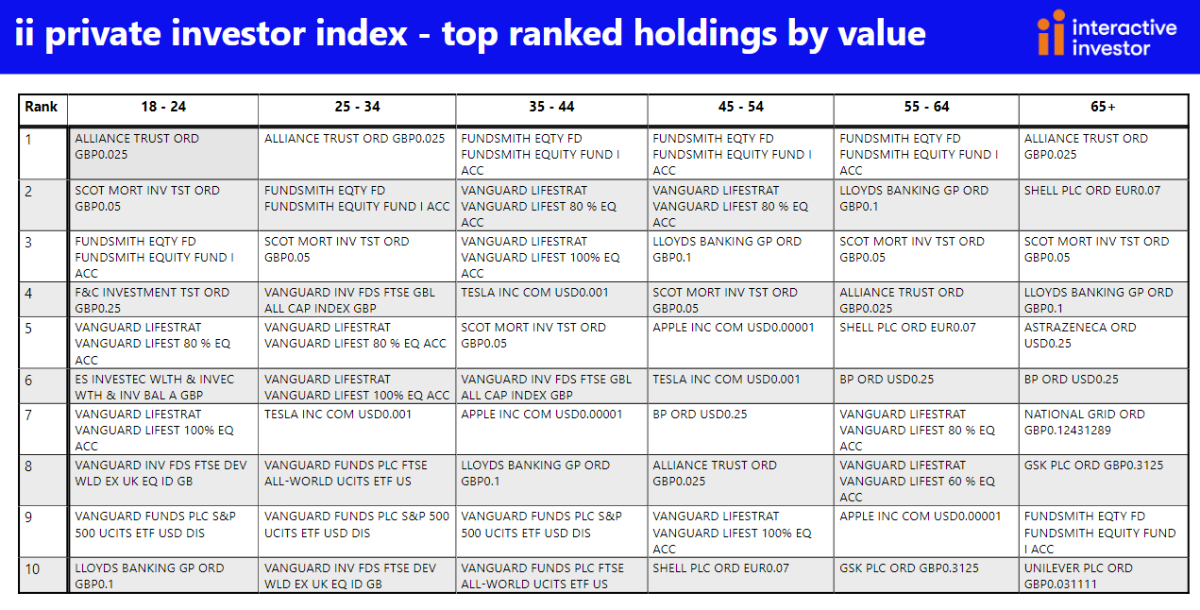
As well as a higher-than-average ETP exposure, this 35-44 cohort also seem to have higher than average US exposure, with Apple (NASDAQ:AAPL), Tesla (NASDAQ:TSLA) and Vanguard S&P 500 UCITS ETF (LSE:VUSD) each in the top 10 most-held instruments in that age cohort.
Oldest customers still proving their mettle over other time frames
The 65+ age cohort has posted the strongest six-month performance (up 8.2% compared to 7.1% for the wider ii customer base). And this group was also down the least over the past year, down -2.1%, versus -2.9% overall for the wider customer base. The 65+ cohort have also posted the strongest returns over the past two years (up 4.1% compared to 2.3% for ii’s wider customer base).
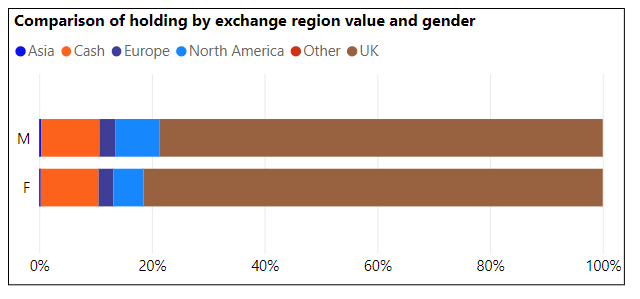
Home bias could be a factor. The past year has seen the FTSE 100 trounce global rivals. Correspondingly, the 65+ age group have the highest exposure to direct equities (43% versus an average of 38%). Direct equity exposure tends to have a UK bias, as the table below demonstrates.
18-24 year olds
And while ii’s youngest 18-24-year old cohort are no longer at the top of the performance charts, over ii’s longest time frame (3 years 3 months), they are still beating the overall average (up 9.2% versus 7.9% overall).
But over one year, they are down the most (down -4.3% versus -2.9% overall).
The 18-24 age category has the lowest direct equity exposure (21% versus 38% overall), and hence the lowest UK exposure, and it is portfolios with the highest UK exposure which have posted the best returns over the short term.
Gender performance comparisons
If we look back to when ii first started collating this data, from 1 January 2020 – 31 March 2023, ii’s female customers have outperformed male customers by one percentage point, up 8.4% versus 7.5% for men.
Women are also outperforming men by 1.5 percentage points over 2 years (up 3.3%), and are down the least over the past difficult year (down -2.4% versus – 3.1% for men). Over shorter periods, performance between the genders is in line.
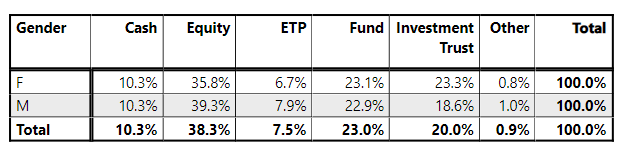
Men and women run their accounts among broadly similar lines, but women tend to have a discernibly higher exposure to investment trusts (23.3% versus 18.6% for men)
Customer and index % returns to 31 March 2023
Cumulative returns (3 years 3 months) | 2 Years | 1 Year | 9 Months | 6 Months | 3 Months | |
Index | 01/01/2020 - 31/03/2023 | 01/04/2021 - 31/03/2023 | 01/04/2022 - 31/03/2023 | 01/07/2022 - 31/03/2023 | 01/10/2022 - 31/03/2023 | 01/01/2023 - 31/03/2023 |
Average ii customer (ii performance index methodology) | 7.9% | 2.3% | -2.9% | 5.1% | 7.1% | 2.4% |
18 - 24yr old (ii customer) | 9.2% | -1.0% | -4.3% | 5.0% | 5.1% | 1.8% |
25 - 34yr old (ii customer) | 9.7% | 0.1% | -4.0% | 5.1% | 5.4% | 2.4% |
35 - 44yr old (ii customer) | 9.8% | 0.8% | -3.8% | 4.9% | 5.4% | 2.7% |
45 - 54yr old (ii customer) | 8.7% | 1.0% | -3.5% | 5.0% | 6.2% | 2.6% |
55 - 64yr old (ii customer) | 7.3% | 1.4% | -3.1% | 5.0% | 6.9% | 2.3% |
65+ yr old (ii customer | 7.5% | 4.1% | -2.1% | 5.3% | 8.2% | 2.2% |
Female ii customer | 8.4% | 3.3% | -2.4% | 5.2% | 7.1% | 2.3% |
Male ii customer | 7.5% | 1.8% | -3.1% | 5.1% | 7.1% | 2.4% |
IA Mixed Investment 40-85% Shares (GBP) | 7.8% | 0.5% | -4.6% | 3.1% | 5.3% | 2.3% |
FTSE 100 (GBP) | 13.6% | 22.3% | 5.4% | 9.5% | 12.5% | 3.6% |
FTSE All Share (GBP) | 10.4% | 16.3% | 2.9% | 8.4% | 12.3% | 3.1% |
FTSE World (GBP) | 33.9% | 14.1% | -0.7% | 9.2% | 7.3% | 4.8% |
S&P 500 (GBP) | 43.7% | 19.1% | -1.7% | 8.0% | 4.4% | 4.6% |
S&P 500 (USD) | 34.1% | 6.7% | -7.7% | 10.0% | 15.6% | 7.5% |
Source: Index performance: Morningstar Total Returns (Base Currencies) to 31/03/2023. ii customer returns source: ii. Past performance is not a guide to the future.
These articles are provided for information purposes only. Occasionally, an opinion about whether to buy or sell a specific investment may be provided by third parties. The content is not intended to be a personal recommendation to buy or sell any financial instrument or product, or to adopt any investment strategy as it is not provided based on an assessment of your investing knowledge and experience, your financial situation or your investment objectives. The value of your investments, and the income derived from them, may go down as well as up. You may not get back all the money that you invest. The investments referred to in this article may not be suitable for all investors, and if in doubt, an investor should seek advice from a qualified investment adviser.
Full performance can be found on the company or index summary page on the interactive investor website. Simply click on the company's or index name highlighted in the article.