ii Private Investor Performance Index: Q2 2022
12th July 2022 09:57
by Jemma Jackson from interactive investor
No escaping the past six months, but private investors weather a volatile two years well.

- ii customers up 13.2% in median terms over two years to end June 2022 – beating Global and UK indices and levelling with the S&P 500
- BUT: Private investors are down -11% in the first half of 2022, while the IA Mixed Investment 40-85% Shares is down 10.8%
- Q2 saw average ii customer down 7.6%, closely in line with to 7.4% for IA Mixed Investment 40-85% Shares sector
- Oldest (65+) age category down the least in H1, cushioned by stalwart FTSE 100 dividend payers, while customers in the 18-24 age range nurse largest losses
interactive investor’s latest Private Investor Performance Index to 30 June 2022 reflects the challenging first six months of the year. Private investors have navigated volatile markets, rising interest rates, looming fears of recession and devastating geopolitical events.
With data now going back two and a half years, the index charts interactive investor’s customer performance data, in median terms*, since the first coronavirus cases emerged in the UK.
How was it for you?
During that volatile two and a half year period since ii started tracking customer performance, the average ii customer is up 2.6%, ahead of the FTSE All-Share (up 0.7%) and the FTSE 100 (up 1.5%), but trailing the FTSE World (up 8.5%) and the S&P 500 index (up 12.1%). The IA Mixed Investment 40-85% shares sector was up 1.8%. The Nasdaq, home to the world’s technology giants, is up 13.3%, but has had the most pronounced falls more recently.
The IA Mixed Investment 40-85% shares sector is a useful comparison because it reflects a mix of equities and bond fund exposure, not to mention cash, that ii customers will have, on average, in their portfolio.
Levelling with Uncle Sam
Over the past two years, the average interactive investor customer has outperformed global and UK indices, and levelled with the S&P 500 index, up 13.2%. That’s no mean feat – the US market is notoriously hard to beat, or even level with. Tech stocks, using the Nasdaq Index, were up 6.4%.
A tough first half of the year
Although investing is very much a long-term game, and we must not dwell too much on the short term, it is important to reflect more recent reality.
Private investors are down -11% in the first half of 2022, while the IA Mixed Investment 40-85% Shares sector is down 10.8% The losses echo the falls of H1 2020, when the average ii customer was down -8.1%, before finishing the year in positive territory. There’s no guarantees that will play out again and it’s noteworthy that the H1 2022 falls are more pronounced than in H1 2020.
The Nasdaq was down 21.1% in the first six months of the year, illustrating the torrid time for tech stocks.
In Q2 2022, the average ii customer is down 7.6%. Historically, customers with £1m-plus accounts have performed the best since ii started publishing this index; but ii’s wealthiest customers suffered a little more in quarter 2, down -8.4% on average over the last three months.
Richard Wilson, CEO, interactive investor, says: “The past six months have seen a number of markets enter into correction territory as central banks begin to take action to end the longest period of hyper-cheap money, and try to chase down inflation with higher interest rates. This, added to supply side shocks, has created market volatility that we can only expect to continue in the near term.
“Long-term investing is about sensible diversification, regular investing and patience that we know in the long run pays dividends. More customers than ever are now using the free ii regular investing service, introduced in January 2020. You cannot time the market but you can benefit from compounding, which remains possibly the most powerful long-term investing tool.”
interactive investor customer performance versus various indices
Investment | Jan 20 - June 22 | 2 Years | 1 Year | 9 Months | 6 Months | 3 Months |
01/01/2020 - 30/06/2022 | 01/07/2020 - 30/06/2022 | 01/07/2021 - 30/06/2022 | 01/10/2021 - 30/06/2022 | 01/01/2022 - 30/06/2022 | 01/04/2022 - 30/06/2022 | |
IA Mixed Investment 40-85% Shares | 1.8 | 4.4 | -7.1 | -8.3 | -10.8 | -7.4 |
FTSE 100 | 1.5 | 11.7 | 5.8 | 3.7 | -1.0 | -3.7 |
FTSE World | 8.5 | 10.4 | -2.8 | -4.7 | -10.9 | -9.1 |
S&P 500 | 12.1 | 13.2 | 1.7 | -1.3 | -10.7 | -9.0 |
FTSE All Share | 0.7 | 11.1 | 1.6 | -0.6 | -4.6 | -5.0 |
Nasdaq Composite | 13.3 | 6.4 | -12.9 | -14.8 | -21.1 | -15.7 |
Average ii customer | 2.6 | 13.2 | -7.0 | -8.4 | -11.0 | -7.6 |
Source: Morningstar (GBP) total returns for FTSE/ IA index/ benchmark performance; ii customer performance is source interactive investor and is total return. Past performance is no guide to the future.
Grey matters – oldest customers down the least in H1
The oldest age group (65+) were down the least in the first six months of the year, but were still down -9.9%, and down by -7.1% in Q2 (also the ‘least worse’ return by age band).
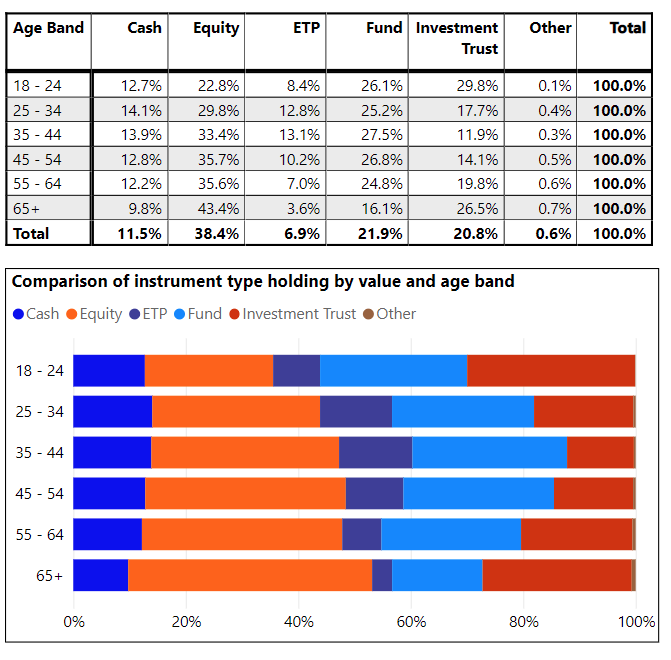
Older customers’ higher than average likely UK exposure will have probably helped here at a time when UK markets have held up well compared to global markets. This age group have the highest direct equity exposure (43% versus an overall average of 38%), and customers direct equity exposure tends to have a UK bias.
Direct equity regional exposure (excludes funds, investment trusts and ETFs)

Over two years, the 65+ group are also ahead – up 15.1%.
Youngest customers see some highs and lows
Over the last six months, ii’s youngest investors (18-24) have suffered the most – down -13.8%, and they are also down the most over three months (down -8.8%).
This may well be down to the fact that 18-24 year olds have the highest investment trust exposure (30% compared to an average customer allocation of 21%) – and the steep falls of widely held Scottish Mortgage (LSE:SMT) won’t have helped. Investment trusts have a strong international focus, and also tend to outperform in rising markets and underperform in falling markets due to gearing (borrowing), which can enhance returns both ways.
It is this same higher-than-average investment trust exposure that has probably helped this age group perform the best longer term, since ii started tracking customer performance in January 2020. 18-24 year olds are up 5.4% over the past two and a half years to 30 June 2022, while the average ii customer is up 2.6%.
Kyle Caldwell, Collectives Specialist, interactive investor says: “Investment trusts are powering many of our customer portfolios, but it is important to take the rough with the smooth. In a rising market, they have some fantastic tools to boost performance, such as gearing (borrowing) to enhance returns. They can also be a great way to access alternative assets, because of their unique, ‘closed ended’ structure, which helps managers take a long-term view of the market. But those same benefits can quickly turn against you when markets fall. Investors should not panic - if you believe in the long-term potential of the stock market, investment trusts are the ultimate active investment.”

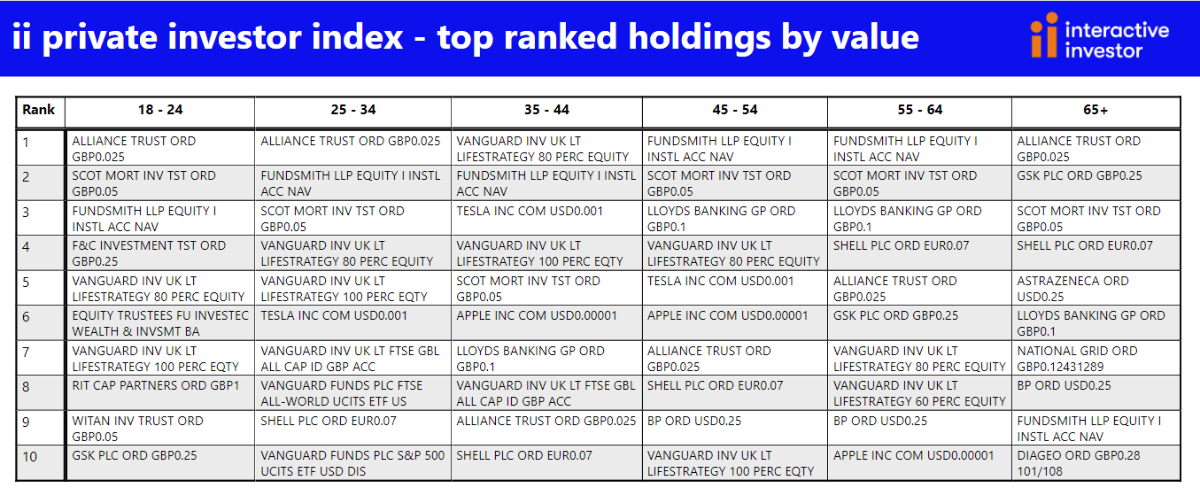
After some dramatic share price falls from Scottish Mortgage Investment Trust, it is no longer the most-held stock for any of the ii age groups, as the value of the assets have fallen and it starts to represent a lower share of the overall portfolio. The most widely held intergenerational stock is now Alliance Trust (LSE:ATST), which is the most-held stock among 18-24 year olds, 25-34 year olds and the 65+ age camp.
Richard Hunter, Head of Markets, interactive investor, adds: “We can see that amid the stormy markets, private investors continue to search for income, and dividend-paying blue-chip names such as Lloyds (LSE:LLOY), Shell (LSE:SHEL), and BP (LSE:BP.) remain popular and a time when we have seen the market shift away from ‘growth’ focused companies.
“Interestingly, we can see a lack of technology stocks, which tend to be more growth-focused, in the portfolios of our youngest investors (18-24 year olds). Our youngest cohort have less direct equity exposure generally, and a higher allocation to investment trusts such as Alliance Trust,Witan (LSE:WTAN), F&C Investment Trust (LSE:FCIT), RIT Capital Partners (LSE:RCP) and Scottish Mortgage. Globally diversified investment trusts can be a great one-stop shop for beginner investors and have been investing on behalf of generations for well over 100 years.”
“However, many investors are choosing to stay away from active strategies in favour of passives. The Vanguard LifeStrategy range featured in the top 10 most-held investments by value across the board, bar those over 65. Active and passive strategies are the ultimate ‘pick and mix’ and there’s room for both in a portfolio.”

Returns by gender
ii’s quarterly performance data has consistently demonstrated little difference between male and female private investor performance, and the first half of the year was no different. The average female customer was down -10.6% in the first half of the year, slightly ahead of the -11.2 falls for men.
Similarly, in Q2 2022, female investors were down 7.4%, and male investors down 7.8%.
Longer term, women are slightly outperforming men, up 3% over the past two and a half years since ii started collating this data, compared to 2.2% for men.
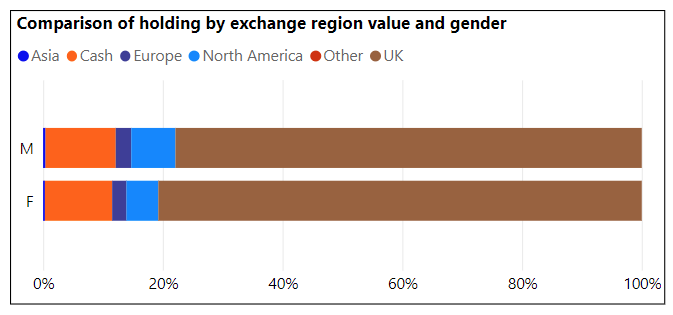
Female customers have a greater preference for investment trusts, and men a slightly higher preference for direct equities, but portfolios are broadly similar. The higher allocation towards investment trusts among women, and by default the higher international focus that tends to come with trusts, may have contributed to this longer-term outperformance.
Interestingly, when it comes to direct equity exposure, men have slightly higher exposure to North America than women (7% versus 5%), and this could explain why women are slightly outperforming men over the year to date, after a tough first half of the year for US markets.
Portfolio breakdown by gender

interactive investor now has around 120,000 female customers.
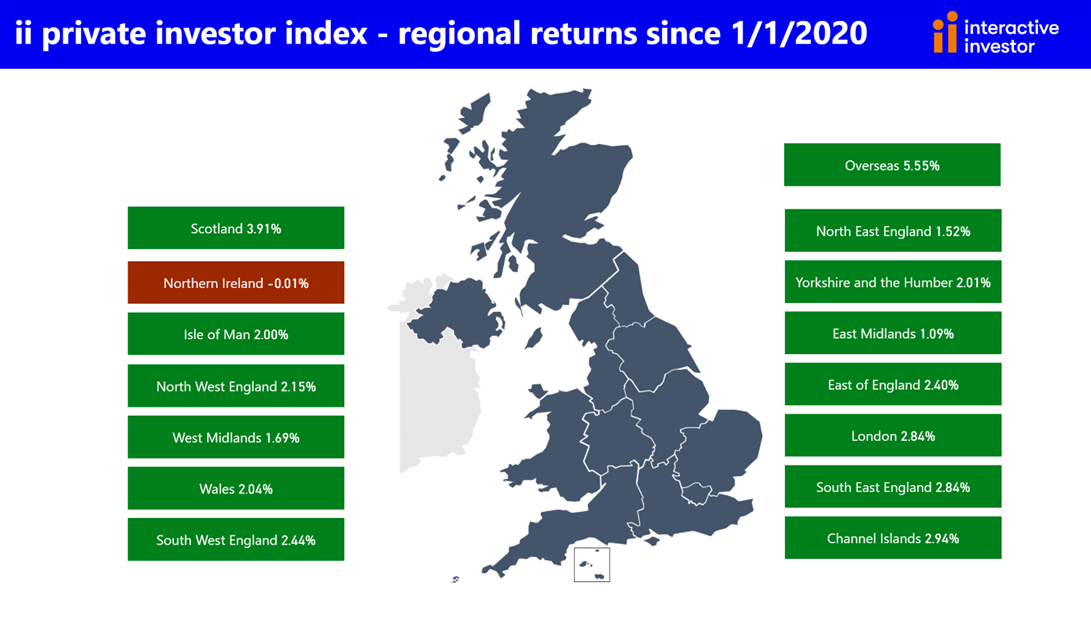
Regional performance

Notes to editors
*ii customer performances quoted are median values to avoid the influence of outlier performance skewing the data.
The performance is calculated using the Time Weighted Rate of Return with returns calculated before each money transaction, then the results compounded over the reporting period. The time-weighted rate of return (TWR) is a measure of the compound rate of growth in a portfolio. It eliminates the distorting effects on growth rates created by inflows and outflows of money.
Then median averages are calculated independently for each group we analysed – so that outlier performances did not skew the results.
Index performance, unless otherwise stated, is ii using Morningstar, total return in GBP, to end June 2022.
Portfolio values under £20,000 were stripped out to keep the sample representative of ii’s core customer base.
These articles are provided for information purposes only. Occasionally, an opinion about whether to buy or sell a specific investment may be provided by third parties. The content is not intended to be a personal recommendation to buy or sell any financial instrument or product, or to adopt any investment strategy as it is not provided based on an assessment of your investing knowledge and experience, your financial situation or your investment objectives. The value of your investments, and the income derived from them, may go down as well as up. You may not get back all the money that you invest. The investments referred to in this article may not be suitable for all investors, and if in doubt, an investor should seek advice from a qualified investment adviser.
Full performance can be found on the company or index summary page on the interactive investor website. Simply click on the company's or index name highlighted in the article.