ii Private Investor Performance Index: Q2 2023
11th July 2023 10:11
by Jemma Jackson from interactive investor
Patience is rewarded, while funds and ETFs prove their mettle as customers in the 35-44 age range start to dominate the performance tables.

The interactive investor Private Investor Performance Index launched at the start of 2020, at the tail end of the longest market bull run in history, spanning a decade.
The Covid-19 pandemic flipped the script, and the subsequent increase in inflation and rising interest rates have ushered in a more challenging environment.
- Invest with ii: Open a Stocks & Shares ISA | What is a Stocks & Shares ISA? | ISA Offers & Cashback
Even so, the average self-directing interactive investor customer portfolio was up 1.7% in the first half of 2023 in median* terms, and up 4.8% over the past year to 30 June 2023.
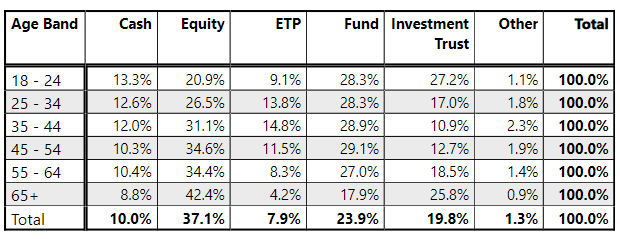
Customers aged 35-44 performed the best over the past year, up 5.6%. They have also significantly outperformed over the year to date, up 2.9%. Their secret is higher than average exposure to funds and ETFs.
The longer-term view
Despite the turbulence of the past three and a half years, private investors managed to generate positive returns since the index was launched, with the average interactive investor customer up 7.4% (and up 18% over the past three years to end June 2023).
Customers in the 35 to 44 and 25 to 34 age brackets performed best in the three and a half years since ii’s index was launched, up 10%.
The common denominator was less exposure to the vagaries of individual stock selection, and more exposure to collective investments – specifically open-ended funds and exchange-traded funds, with investment trusts taking a back seat.
Richard Wilson, CEO, interactive investor, says: “The ups and downs of markets means that our Private Investor Performance Index isn’t always going to make for comfortable reading. Our customers are up just under 2% in median terms over the year to date – that’s no mean feat given the environment, but it comes at a time when cash savings rates have risen.
“Longer term, this comprehensive snapshot of how self-directing private investors are faring, the only one of its kind, shows how important it is to stay invested through the turbulence, and how collective investments can help diversify portfolios.
“And with the average customer up 18% over the past three years, we can also see that if we hold our nerve when things feel most uncomfortable, as they did three years ago, this too can pay dividends. It isn’t always easy, but it is key to long-term wealth creation, and it’s powerful.”
ETFs taking off?
ETFs have been slower to take off in the UK, but things are starting to change among younger age groups. The 35 to 44 age range had almost double the ETF exposure than the average ii customer (15% versus 8%), with 25 to 34 year olds not far behind (14%). And fund exposure was between 4-5 percentage points higher than the overall average in these younger age groups.
In contrast, the 35-44 age group only have 11% in investment trusts versus 20% for the average customer. Investment trusts tend to outperform in rising markets and struggle more in volatile markets, due to gearing (borrowing) which can enhance returns.
Three-year data - investing on the big dip
The average interactive investor customer has enjoyed double-digit returns over the past three years to the end of June 2023. The average ii customer is up 18.3% in median terms over three years, led by customers aged 65 plus, who are up 20% in median terms.
This three year data outstrips the return achieved by professional investors, as measured by the IA Mixed Investment 40-85% shares sector (up 12.6%). This IA sector is a useful comparator with private investor portfolios, with its mix of bonds, cash and equities. But private investors and professional managers were well behind the S&P 500, up 46% in GBP terms, and the FTSE All-Share.
The oldest aged 65-plus cohort who posted the best three-year returns have the highest direct equity exposure, and the lowest exposure to cash, illustrating how different strategies can work in different market environments. They also have higher than average exposure to investment trusts, which have shown their strengths in a more favourable market environment.
Over the longest time frame (3 years 6 months, when ii started collating the data), customers overall have performed almost in line with professional managers (up 7.4% versus 7.9% for the IA Mixed Investment 40-85% shares sector).
But the most recent quarter (Q2 2023) was particularly tough for private investors, following dizzying shifts in market sentiment. The average portfolio was down -0.4% in median terms in Q2.
Home bias weighs on portfolios
The UK and US markets experienced opposite fortunes in Q2 2023. Stubbornly high inflation and expectations of higher than forecast interest rates weighed on UK stocks, with the FTSE 100 and FTSE All-Share indices returning -0.3% and -0.5%, respectively.
Across the Atlantic, the US market bounce back continues - fuelled by surging tech stocks as interest in AI booms. In quarter 2, the S&P 500 is up 5.8% (in GBP terms) over the period, while the FTSE World (64% of which is weighted to US stocks), is up 3.9% in GBP terms.
Given that UK investments make up 80% of the average ii customer portfolio when it comes to direct equities, it is perhaps not surprising to observe that the average investor yielded a return that sits in the middle of that generated by the FTSE 100 and FTSE All-Share.
Richard Hunter, Head of Markets, interactive investor, says: “US markets finished the half-year in some style, driven in particular by the mega-cap technology stocks which have come to typify hopes that an end to the rate-hiking cycle is firmly in sight. Hopes that the Federal Reserve now has an end game has prompted surging buying interest in the tech sector, although the second half of the year could pose questions as valuations and results will be scrutinised given these higher expectations.
“Meanwhile, the FTSE 100 has neither sustained the strength of earlier year gains nor reflected the bounces of other global indices. UK markets kicked off the second half in typically understated style. The premier index inched higher, with some of the boost being attributable to the positive news coming from the US and a marginally weaker sterling.
“Questions over the UK economy also weighed on the smaller listed UK companies as the likelihood of more interest rate rises weigh against tepid economic growth, implying a recession although the severity of such a slowdown remains under debate.”
Quarter two snapshot
After outperforming the other age categories, ii customers in the 35 to 44 age cohort also led the march in Q2, generating a positive return of 0.5% in median terms, closely followed by customers in the 18 to 24 and 25 to 34 age categories, each up 0.4% respectively. On average, ii customers were down -0.4% in median terms.
Gender performance comparisons
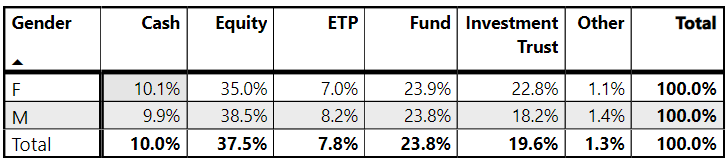
ii’s female customers have outperformed male customers since January 2020, up 8% versus 6.8% for men in median terms. The performance gap between the sexes widens over a two-year period to 30 June 2023 – although returns are in the negative for both cohorts (-1.3% for women versus -2.6% for men).
Over all other time frames, there is little difference between male and female private investor performance.
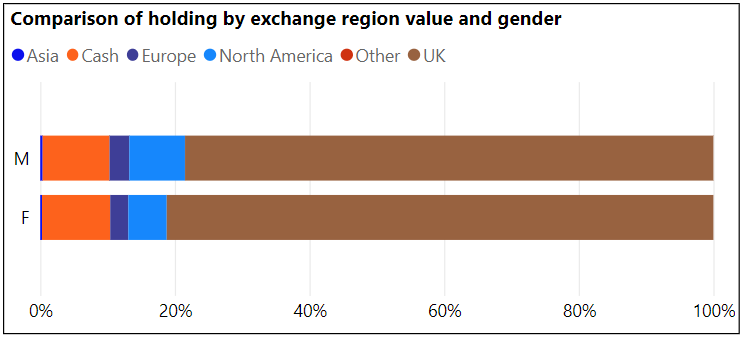
Men and women run their accounts among broadly similar lines, although women have a greater preference for investment trusts (accounting for 22.8% of the average female portfolio versus 18.2% for men), and men a slightly higher preference for direct equities (38.5% versus 35%).
The higher allocation towards investment trusts among women, and by default the higher international focus that tends to come with trusts, may have contributed to this longer-term outperformance over the past three and a half years.
Customer and index cumulative percentage returns to 30 June 2023
3 years 6 months | 3 years | 2 years | 1 year | 9 months | 6 months | 3 months | |
Average ii customer (ii performance index methodology) | 7.4% | 18.3% | -2.2% | 4.8% | 7.1% | 1.7% | -0.4% |
18 - 24 | 9.1% | 15.6% | -4.8% | 5.4% | 6.0% | 1.9% | 0.4% |
25 - 34 | 9.9% | 16.5% | -4.3% | 5.5% | 6.4% | 2.5% | 0.4% |
35 - 44 | 10.1% | 16.8% | -2.6% | 5.6% | 6.5% | 2.9% | 0.5% |
45 - 54 | 8.6% | 17.5% | -2.8% | 5.3% | 6.7% | 2.4% | 0.1% |
55 - 64 | 6.8% | 17.5% | -3.0% | 4.6% | 6.9% | 1.7% | -0.4% |
65+ | 6.5% | 19.7% | -1.2% | 4.5% | 7.6% | 1.2% | -0.8% |
F | 8.0% | 18.6% | -1.3% | 4.9% | 7.2% | 1.7% | -0.4% |
M | 6.8% | 18.3% | -2.6% | 4.8% | 7.1% | 1.7% | -0.5% |
IA Mixed Investment 40-85% Shares (GBP) | 7.9 | 12.6 | -4.1 | 3.3 | 5.5 | 2.4 | 0.2 |
FTSE 100 TR (GBP) | 13.2 | 36.2 | 15.4 | 9.1 | 12.2 | 3.2 | -0.3 |
FTSE All Share TR (GBP) | 9.9 | 33.2 | 9.7 | 7.9 | 11.7 | 2.6 | -0.5 |
FTSE World TR (GBP) | 39.1 | 38.3 | 10.2 | 13.5 | 11.4 | 8.9 | 3.9 |
S&P 500 TR (GBP) | 52.0 | 46.3 | 16.2 | 14.2 | 10.4 | 10.6 | 5.8 |
S&P 500 TR (USD) | 45.9 | 50.5 | 6.9 | 19.6 | 25.7 | 16.9 | 8.7 |
Source: Index performance: Morningstar Total Returns (Base Currencies) to 30 June 2023. ii customer returns source, with income reinvested: ii. Past performance is not a guide to the future.
These articles are provided for information purposes only. Occasionally, an opinion about whether to buy or sell a specific investment may be provided by third parties. The content is not intended to be a personal recommendation to buy or sell any financial instrument or product, or to adopt any investment strategy as it is not provided based on an assessment of your investing knowledge and experience, your financial situation or your investment objectives. The value of your investments, and the income derived from them, may go down as well as up. You may not get back all the money that you invest. The investments referred to in this article may not be suitable for all investors, and if in doubt, an investor should seek advice from a qualified investment adviser.
Full performance can be found on the company or index summary page on the interactive investor website. Simply click on the company's or index name highlighted in the article.