ii Private Investor Performance Index: Q4 2022
16th January 2023 10:45
by Jemma Jackson from interactive investor
Portfolios bear marks of a tumultuous year, but Q4 marks a return to form and female investors lead the charge.

- Average ii customer down -8.83% in 2022, with ii’s female customers down the least
- Over three years, average ii customer portfolio up 5.34% in median terms, beating UK markets and IA mixed assets sector, with female customer portfolios up the most
- But ii’s wealthiest customers perform the best over three years, up 10.32%, almost double the average ii customer
- Looking at the different age cohorts, younger investors performed the best over three years, but the 65+ cohort leading the pack over the shorter-term
Now with three-year data, interactive investor, the UK’s second-largest investment platform for private investors, has published its latest Private Investor Performance Index* to 31 December 2022.
- Invest with ii: Open a Stocks & Shares ISA | ISA Investment Ideas | Transfer a Stocks & Shares ISA
It has been a tumultuous period for private investors. After a hard-won rebound following the November 2020 ‘Pfizer day’ Covid vaccine breakthrough, the roller-coaster ride has continued. Investors have endured a 2022 rattled by inflation, rising interest rates, slow economic growth, a tech sell-off and money market chaos.
During this volatile three years, the average interactive investor customer managed to stay in positive territory, up 5.34% in median terms, with female customers faring the best (up 5.96% versus 4.79% for men). That’s well ahead of UK markets, but behind world markets (see table).
Richard Wilson, CEO, interactive investor, says: “Our Private Investor Performance Index won’t always make a comfortable read, and coincides with an extraordinary period in time.
“Not even the most finely tuned investment portfolios were spared in 2022, and the average customer portfolio was down almost 9%. The twists and turns of the past three years show the importance of diversification.
“In spite of all this volatility, on a three-year basis the average ii customer remains in positive territory. Interestingly, our female cohort are performing the best on both a one year and three-year basis. The only certainty in the short-term is more uncertainty, given the nature of markets, but taking a long-term view is key to long-term wealth creation. In January 2020 we introduced free regular investing to help smooth out some of the highs and lows in the price of shares and mitigate the risk of market timing.”
A year to forget
Homing in on the past year, the data lays bare the scale of market volatility in 2022. The average interactive investor customer was down -8.83% in median terms over the year to 31 December 2022, with female customer portfolios down the least (-8.02 versus -9.21 for men).
Professional investors, as measured by the IA Mixed Investment 40-85% Shares sector, were down -10.2%. This sector has the mix of bonds, cash and equities not dissimilar to those which might be found in private investor portfolios.
The FTSE World was down -7.2 in GBP terms, while the FTSE 100 was up 4.7%, boosted by energy stocks and weaker Sterling. The FTSE All Share was little moved by the year end (0.3%).
Interactive investor’s older customers in the 65+ camp performed the ‘least worse’, down -7.29% in 2022, and ii’s youngest adult cohort in the 18-24 age camp performed the worse, down -11.63%.
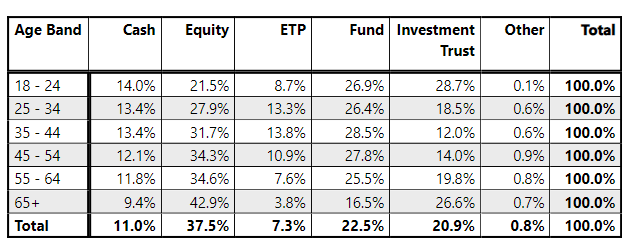
This may well be down to the fact that 18–24-year-olds have the highest investment trust exposure (28.7% compared to an average customer allocation of 20.9%) – and the steep falls of widely held Scottish Mortgage (LSE:SMT) Investment Trust won’t have helped. Investment trusts have a strong international focus, and also tend to outperform in rising markets and underperform in falling markets due to gearing (borrowing), which can enhance returns. It is this same higher than average investment trust exposure which has probably helped this age group perform the best longer term.
Meanwhile, older customers’ have a higher exposure to direct equities, with the 65+ holding the most in their portfolios (42.9% versus an overall average of 37.5%). Customers direct equity exposure tends to have a UK bias, which could also go some way in explaining the relative outperformance of older customers.
Q4 marks a reprieve
In the face of these headwinds, Q4 2022 marked a reprieve. The average ii customer was up 4.83% in median terms, outstripping the return of the FTSE World (up 2.3%) and IA Mixed Investment 40-85% Shares (up 3%). Neither could rival the performance of the UK market, with the FTSE 100 and FTSE All-Share up 8.7% and 8.9% respectively.
During this short-term period, it is ii’s oldest customers who have produced the best returns. The 65+ cohort returned 6.12% in Q4 in median terms, followed by the 55-64 cohort, up 4.71% over the period. This reflects a higher direct equity exposure amongst ii’s older cohort, where there is a correspondingly higher exposure to UK stocks.
The past three years in more detail
During this volatile three-year period the average interactive investor customer is up 5.34%, ahead of the IA Mixed Investment 40-85% shares sector (up 1.8%). Interactive investor’s wealthiest (£1m plus) customers performed the best over this period, up 10.32%.
The FTSE All Share is up 2.3% and the FTSE 100 is up 3.1%. But the average ii customer trailed the FTSE World (up 8.5%) and the S&P 500 index (up 11.2% in GBP terms).
The average female customer outperformed the average male customer by 1 percentage point (up 5.96%, versus 4.79% for men), while ii’s youngest investors boast the best performance since the index’s inception three years ago, with the 18-24 age cohort performing best returning 7.89% ahead of the 25-34 group, up 7.44%.
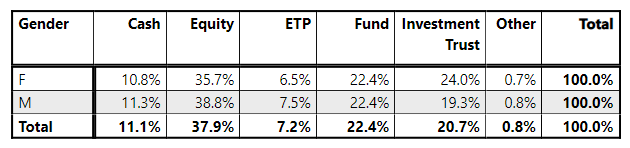
interactive investors female and younger customers have one thing in common – a higher than average allocation to investment trusts. Women have an average exposure to investment trusts of 24% versus 19% for men. 18-24 year olds have an average exposure of 29% to investment trusts, against an overall average of 21%.
Performance to 31 December 2022 - % Total returns
Categories | 3 years | 2 years | 1 year | 9 months | 6 months | Q4 (3 months) |
FTSE 100 (GBP) | 3.1 | 11.4 | 4.7 | 1.8 | 5.7 | 8.7 |
FTSE All Share (GBP) | 2.3 | 9 | 0.3 | -0.2 | 5.1 | 8.9 |
FTSE World (GBP) | 8.5 | 6.5 | -7.2 | -5.2 | 4.2 | 2.3 |
S&P 500 (GBP) | 11.2 | 9.4 | -7.8 | -6 | 3.3 | -0.2 |
S&P 500 (USD) | 7.7 | 2.7 | -18.1 | -14.2 | 2.3 | 7.6 |
IA Mixed Investment 40-85% Shares (GBP) | 1.8 | -0.1 | -10.2 | -6.7 | 0.9 | 3 |
Average ii investor (median terms) | 5.3% | 2.8% | -8.8% | -5.2% | 2.5% | 4.8% |
ii customer age 18 - 24 | 7.9% | -0.4% | -11.6% | -6.1% | 3.3% | 3.3% |
Ii customer age 25 - 34 | 7.4% | -0.1% | -10.9% | -6.5% | 2.4% | 3.1% |
ii customer age 35 - 44 | 6.8% | 0.2% | -10.3% | -6.6% | 1.8% | 2.5% |
ii customer 45 - 54 | 5.7% | 1.0% | -10.0% | -6.2% | 2.1% | 3.6% |
ii customer 55 - 64 | 4.7% | 2.0% | -9.4% | -5.5% | 2.4% | 4.7% |
ii customer 65+ | 5.1% | 5.2% | -7.3% | -4.3% | 3.0% | 6.1% |
ii customer aged £1m+ | 10.3% | 4.2% | -9.2% | -5.3% | 3.2% | 4.7% |
ii Female customer | 6.0% | 3.8% | -8.0% | -4.7% | 2.8% | 5.0% |
ii Male customer | 4.8% | 2.4% | -9.2% | -5.5% | 2.4% | 4.8% |
Source: Morningstar Total Returns to 31/12/2022, expect for ii customer data, which is Source: ii (also total return to end December 2022).
Past performance is no guide to future performance. The performance of investments can go down as well as up and you may not get back the full amount invested.
See notes to editors for methodology
Portfolio composition - Age band comparisons
Portfolio composition – gender comparisons
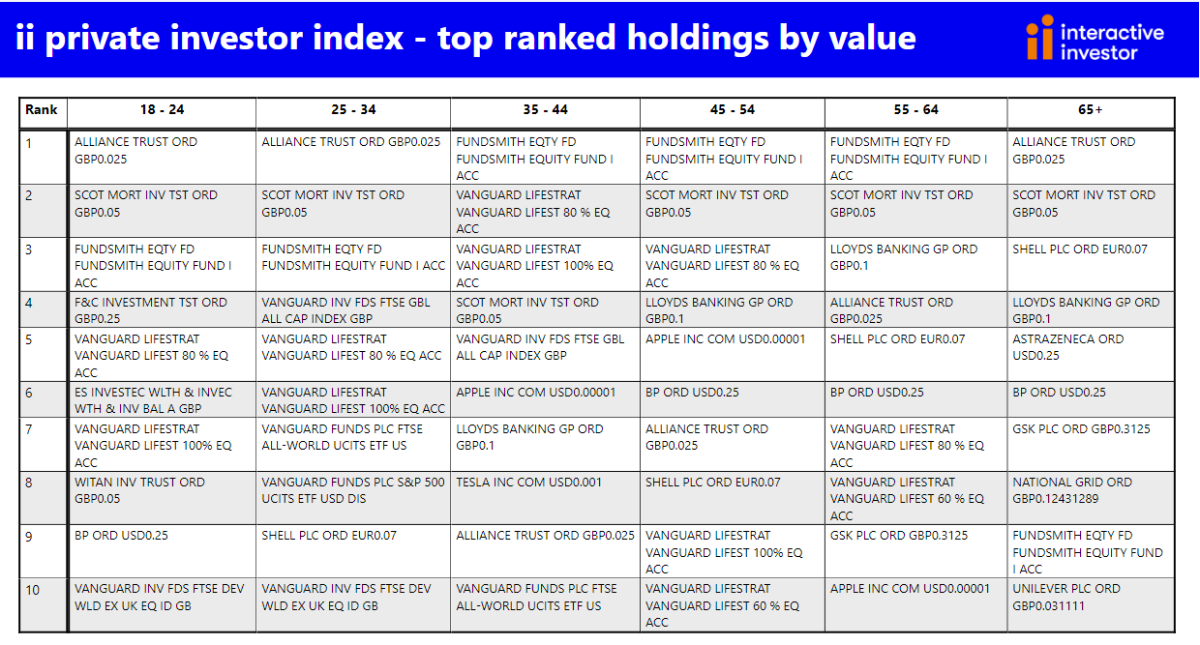
Top holdings trends
Alliance Trust (LSE:ATST) and Fundsmith Equity hog the top spots of most-held stocks by value, with Alliance Trust favoured by the old and young alike. Scottish Mortgage Investment Trust is the second most-held stock except for in the 35-44 category, where Vanguard LifeStrategy 80% Equity is in second place. Among all age categories, variants of the Vanguard LifeStrategy range featured in the top 10 most-held investments by value across the board – bar those 65+ (on average).
Among stocks, BP (LSE:BP.) remains popular, featuring in the top 10 bestsellers among the 18-24, 45-54, 55-64 and 65+ cohorts.
Shell (LSE:SHEL) featured in the most popular list in three out of the six age categories (with the exception of 18-24 and 35-44 groups. Tech and FAANG stocks are thin on the ground, not surprisingly given the poor performance of tech stocks last year. Apple Inc (NASDAQ:AAPL) appears in the most held by value among those aged 35-44, 45-54 and 55-64. Tesla Inc (NASDAQ:TSLA)makes a brief appearance, and is in the most held stocks in the 35-44 age category.
Notes to editors
*ii customer performances quoted are median values to avoid the influence of outlier performance skewing the data.
The performance is calculated using the Time Weighted Rate of Return with returns calculated before each money transaction, then the results compounded over the reporting period. The time-weighted rate of return (TWR) is a measure of the compound rate of growth in a portfolio. It eliminates the distorting effects on growth rates created by inflows and outflows of money.
Then median averages are calculated independently for each group we analysed – so that outlier performances did not skew the results.
Index performance, unless otherwise stated, is ii using Morningstar, total return in GBP, to end December 2022.
Portfolio values under £20,000 were stripped out to keep the sample representative of ii’s core customer base.
These articles are provided for information purposes only. Occasionally, an opinion about whether to buy or sell a specific investment may be provided by third parties. The content is not intended to be a personal recommendation to buy or sell any financial instrument or product, or to adopt any investment strategy as it is not provided based on an assessment of your investing knowledge and experience, your financial situation or your investment objectives. The value of your investments, and the income derived from them, may go down as well as up. You may not get back all the money that you invest. The investments referred to in this article may not be suitable for all investors, and if in doubt, an investor should seek advice from a qualified investment adviser.
Full performance can be found on the company or index summary page on the interactive investor website. Simply click on the company's or index name highlighted in the article.