ii view: commodity costs force Procter & Gamble price hikes
The defensive company can offset higher costs, but home care sales and the dividend are up double digits.
20th April 2021 15:36
by Keith Bowman from interactive investor
The defensive company can offset higher costs, but home care sales and the dividend are up double digits.
Third-quarter results to 31 March
- Net sales up 5% to $18.1 billion
- Core earnings per share (eps) up 8% to $1.26
- Dividend up 10% from the prior quarter to $0.8698 per share
Chief executive David Taylor said:
“We delivered another quarter of solid top-line, bottom-line and cash results in what continues to be a challenging operating environment. We remain focused on executing our strategies of superiority, productivity, constructive disruption and improving P&G’s organization and culture.
“These strategies enabled us to build strong business momentum before the Covid crisis and accelerate our progress during the crisis, and they remain the right strategies to deliver balanced growth and value creation over the long term.”
ii round-up:
Consumer goods giant Procter & Gamble (NYSE:PG) has flagged product price increases across categories such as baby and feminine care as it battles an expected full-year commodity cost increase of around $125 million.
Sales and earnings for the quarter to the end of March beat Wall Street expectations, as increased consumer demand for its cleaning products forged at the height of the pandemic continued.
P&G shares slipped around 1% lower in early US trading, having gained by around 40% since virus induced market lows in March 2020. Shares for Domestos owner Unilever (LSE:ULVR) are up around 5% over the same time, while shares of Dettol firm Reckitt Benckiser (LSE:RKT) have gained nearer 14%.
Unlike the two previous quarters, P&G management left its estimate for full-year organic sales unchanged at up between 5% to 6%.
Fabric & home care and beauty products both led quarterly gains in divisional organic sales, each climbing by 7%. Excluding fabric care, home care products, including such brands as Fairy and Viakal, reported an organic sales gain in the high teens. Beauty care brands include Pantene, Head & Shoulders and Herbal Essences.
Organic sales for its baby, feminine and family care division trailed divisional performers, falling by 1%. Brands include Pampers, Always and Tampax.
Management now expects to buy back as much as $11 billion of its own stock during this full financial year, up from a prior estimate of around $10 billion.
Earlier in April, the Cincinnati-headquartered company declared a quarterly dividend payment of $0.8698 per share, a 10% hike compared to the prior second quarter. That marks the 65th consecutive year that P&G has increased its dividend payment.
ii view:
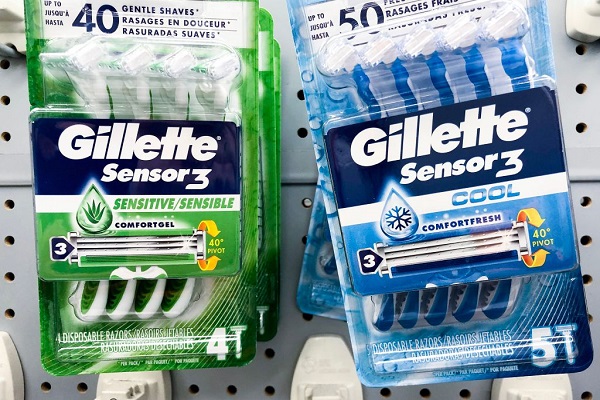
Procter & Gamble operates across the five divisions of fabric & home care, baby, feminine & family care, beauty, health care and grooming. Its many brands include Ariel, Bold, Braun, Febreze, Gillette, Lenor, Olay, Oral-B and Vicks. It has operations in approximately 70 countries worldwide. North America accounts for just under half of its sales, with Europe at just over a fifth and Asia and China at around a tenth each.
For investors, quality and dependability do not come cheap. The estimated forward price/earnings ratio of around 24 is above both the three and 10-year averages, suggesting any slip-ups in performance would be punished.
But its list of household brand names is long. Many products feature regularly in consumer shops globally making it relatively defensive. A dividend yield of over 2% is also not to be overlooked in an era of ultra-low interest rates, especially given its payment of a dividend for 131 consecutive years since incorporation in 1890. In all, P&G looks to remain worthy of a position in diversified long-term focused portfolios.
Positives:
- Product and geographical diversity
- Progressive dividend policy
Negatives:
- Above average valuation
- Environmental product concerns
The average rating of stock market analysts:
Buy
These articles are provided for information purposes only. Occasionally, an opinion about whether to buy or sell a specific investment may be provided by third parties. The content is not intended to be a personal recommendation to buy or sell any financial instrument or product, or to adopt any investment strategy as it is not provided based on an assessment of your investing knowledge and experience, your financial situation or your investment objectives. The value of your investments, and the income derived from them, may go down as well as up. You may not get back all the money that you invest. The investments referred to in this article may not be suitable for all investors, and if in doubt, an investor should seek advice from a qualified investment adviser.
Full performance can be found on the company or index summary page on the interactive investor website. Simply click on the company's or index name highlighted in the article.