ii view: retailer B&M beefs up profit expectations
Rising energy bills and elevated inflation. We assess prospects for this UK and French discount retailer.
6th January 2022 15:28
by Keith Bowman from interactive investor
Amid rising energy bills and elevated inflation, we assess prospects for this UK and French discount retailer.

Third-quarter trading update to 25 December
- Total currency adjusted revenue up 0.1% to £1.395 billion
- UK only like-for-like revenue down 6.2% year-over-year - up 14% compared to Q3 2019
- French revenue up 30% year-over-year to £108.8 million
Guidance:
- Now expects adjusted earnings (EBITDA) of between £605 million to £625 million, above the consensus analyst estimate of £578 million
Chief executive Simon Arora said:
“The consistency of performance in the core B&M UK business reflects the growing appeal of our stores as a destination visit for seasonal products, as well as the strength of our supply chain.
“Although the pandemic continues to create challenges for retailers and consumers alike, our relentless focus on value-for-money remains undiminished. Despite ongoing supply chain disruption, inflationary pressures and uncertainty surrounding possible Covid-related restrictions, we remain confident in B&M's prospects for 2022. "
ii round-up:
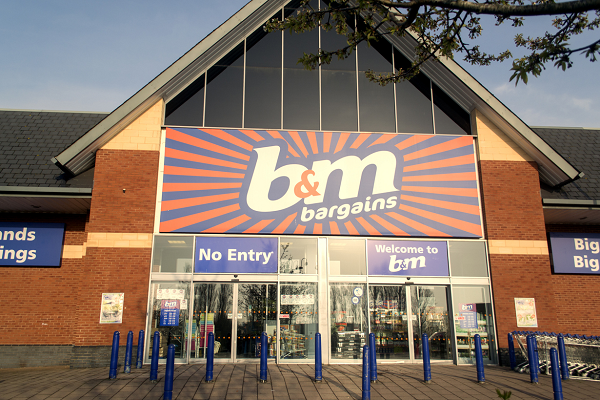
Value goods and food retailer B&M European Value Retail (LSE:BME) today reported a 6.2% retreat in same-store UK sales as it overlapped last year's strong comparatives which benefited from the pandemic.
UK like-for-like sales on a two-year basis, providing a pre-pandemic comparative, rose by 14%. Total sales that include its smaller French business and newly opened stores edged 0.1% higher to £1.395 billion on a currency adjusted basis.
Helped by improved product availability and sales at full price, B&M raised its full-year adjusted earnings (EBITDA) forecast to between £605 million and £625 million. That’s ahead of the current analyst consensus estimate of £578 million.
B&M shares fell more than 2% in UK trading, having more than doubled since pandemic market lows in March 2020. Its shares are up by around 18% over the last year compared to a gain of 9.2% for the wider FTSE 100 index. Shares for fellow retailer Next (LSE:NXT) are up by around 2% over the last year.
UK store numbers now total 693 compared to 673 a year ago. Sales for its 310 Heron Foods outlets totalled £105.2 million during the quarter, up from £102.9 million in the Christmas quarter last year.
France store numbers rose to 107 from 104 a year ago, with sales growing by 30% to £108.8 million. All but one of its French outlets is now under the B&M banner.
ii view:
B&M Group was founded in 1978 and listed on the London Stock Exchange in June 2014. The retailer’s products range from food to home furnishings, DIY items and children's toys. It joined the FTSE 100 index in September 2020 and today has a stock market value of over £6 billion. That’s bigger than Marks & Spencer (LSE:MKS) and close to that of supermarket operator Sainsbury's (LSE:SBRY).
For investors, tough comparatives given the previous boost from the pandemic should not be forgotten. An estimated price/earnings (PE) ratio above the three-year average also suggests the shares are not obviously cheap. But an historical and forecast dividend yield of over 2% is not completely derisory in the current ultra-low interest rate environment, with a series of recent special dividends adding to shareholder returns. For now, and with potential hikes in both taxes and energy bills looming, this discount retailer is unlikely to be forgotten by inflation squeezed consumers.
Positives:
- Diversified product range
- Relatively attractive shareholder returns
Negatives:
- Elevated valuation
- Exposure to currency movements
The average rating of stock market analysts:
Strong hold
These articles are provided for information purposes only. Occasionally, an opinion about whether to buy or sell a specific investment may be provided by third parties. The content is not intended to be a personal recommendation to buy or sell any financial instrument or product, or to adopt any investment strategy as it is not provided based on an assessment of your investing knowledge and experience, your financial situation or your investment objectives. The value of your investments, and the income derived from them, may go down as well as up. You may not get back all the money that you invest. The investments referred to in this article may not be suitable for all investors, and if in doubt, an investor should seek advice from a qualified investment adviser.
Full performance can be found on the company or index summary page on the interactive investor website. Simply click on the company's or index name highlighted in the article.