Investment lessons from 2021’s top-performing funds
We explain why it is important to closely monitor the performance of specialist funds.
12th January 2022 08:41
by Kyle Caldwell from interactive investor
We explain why it is important to closely monitor the performance of specialist funds.
Investors who had the foresight or fortune to back one of the 10 top-performing funds of 2021 will have made returns of more than 40%. Those, however, with money in one of the 10 worst performers will be sitting on losses ranging between 24% and 35%.
With the winners, it is important to not fall into the trap of performance chasing – particularly given that specialist funds regularly feature among the top performers over a calendar year. Such funds often bounce back strongly from a period of poor or subdued performance.
- Funds Fan: four predictions for 2022 and Allianz Technology interview
- Bull and bear points for major equity markets at start of 2022
- Income tips for 2022: should investors go global or back the UK?
In 2021 this was the case, as energy specialist funds dominated the top 10 performers, on the back of surging oil and gas prices. In 2020, when the oil price slumped from $70 to $20, energy funds were among the worst-performing funds. In fact, four of the six top-performing funds of 2021 were in the bottom 10 fund performers of 2020: Schroder ISF Global Energy, TB Guinness Global Energy, Guinness Global Energy and BlackRock GF World Energy.
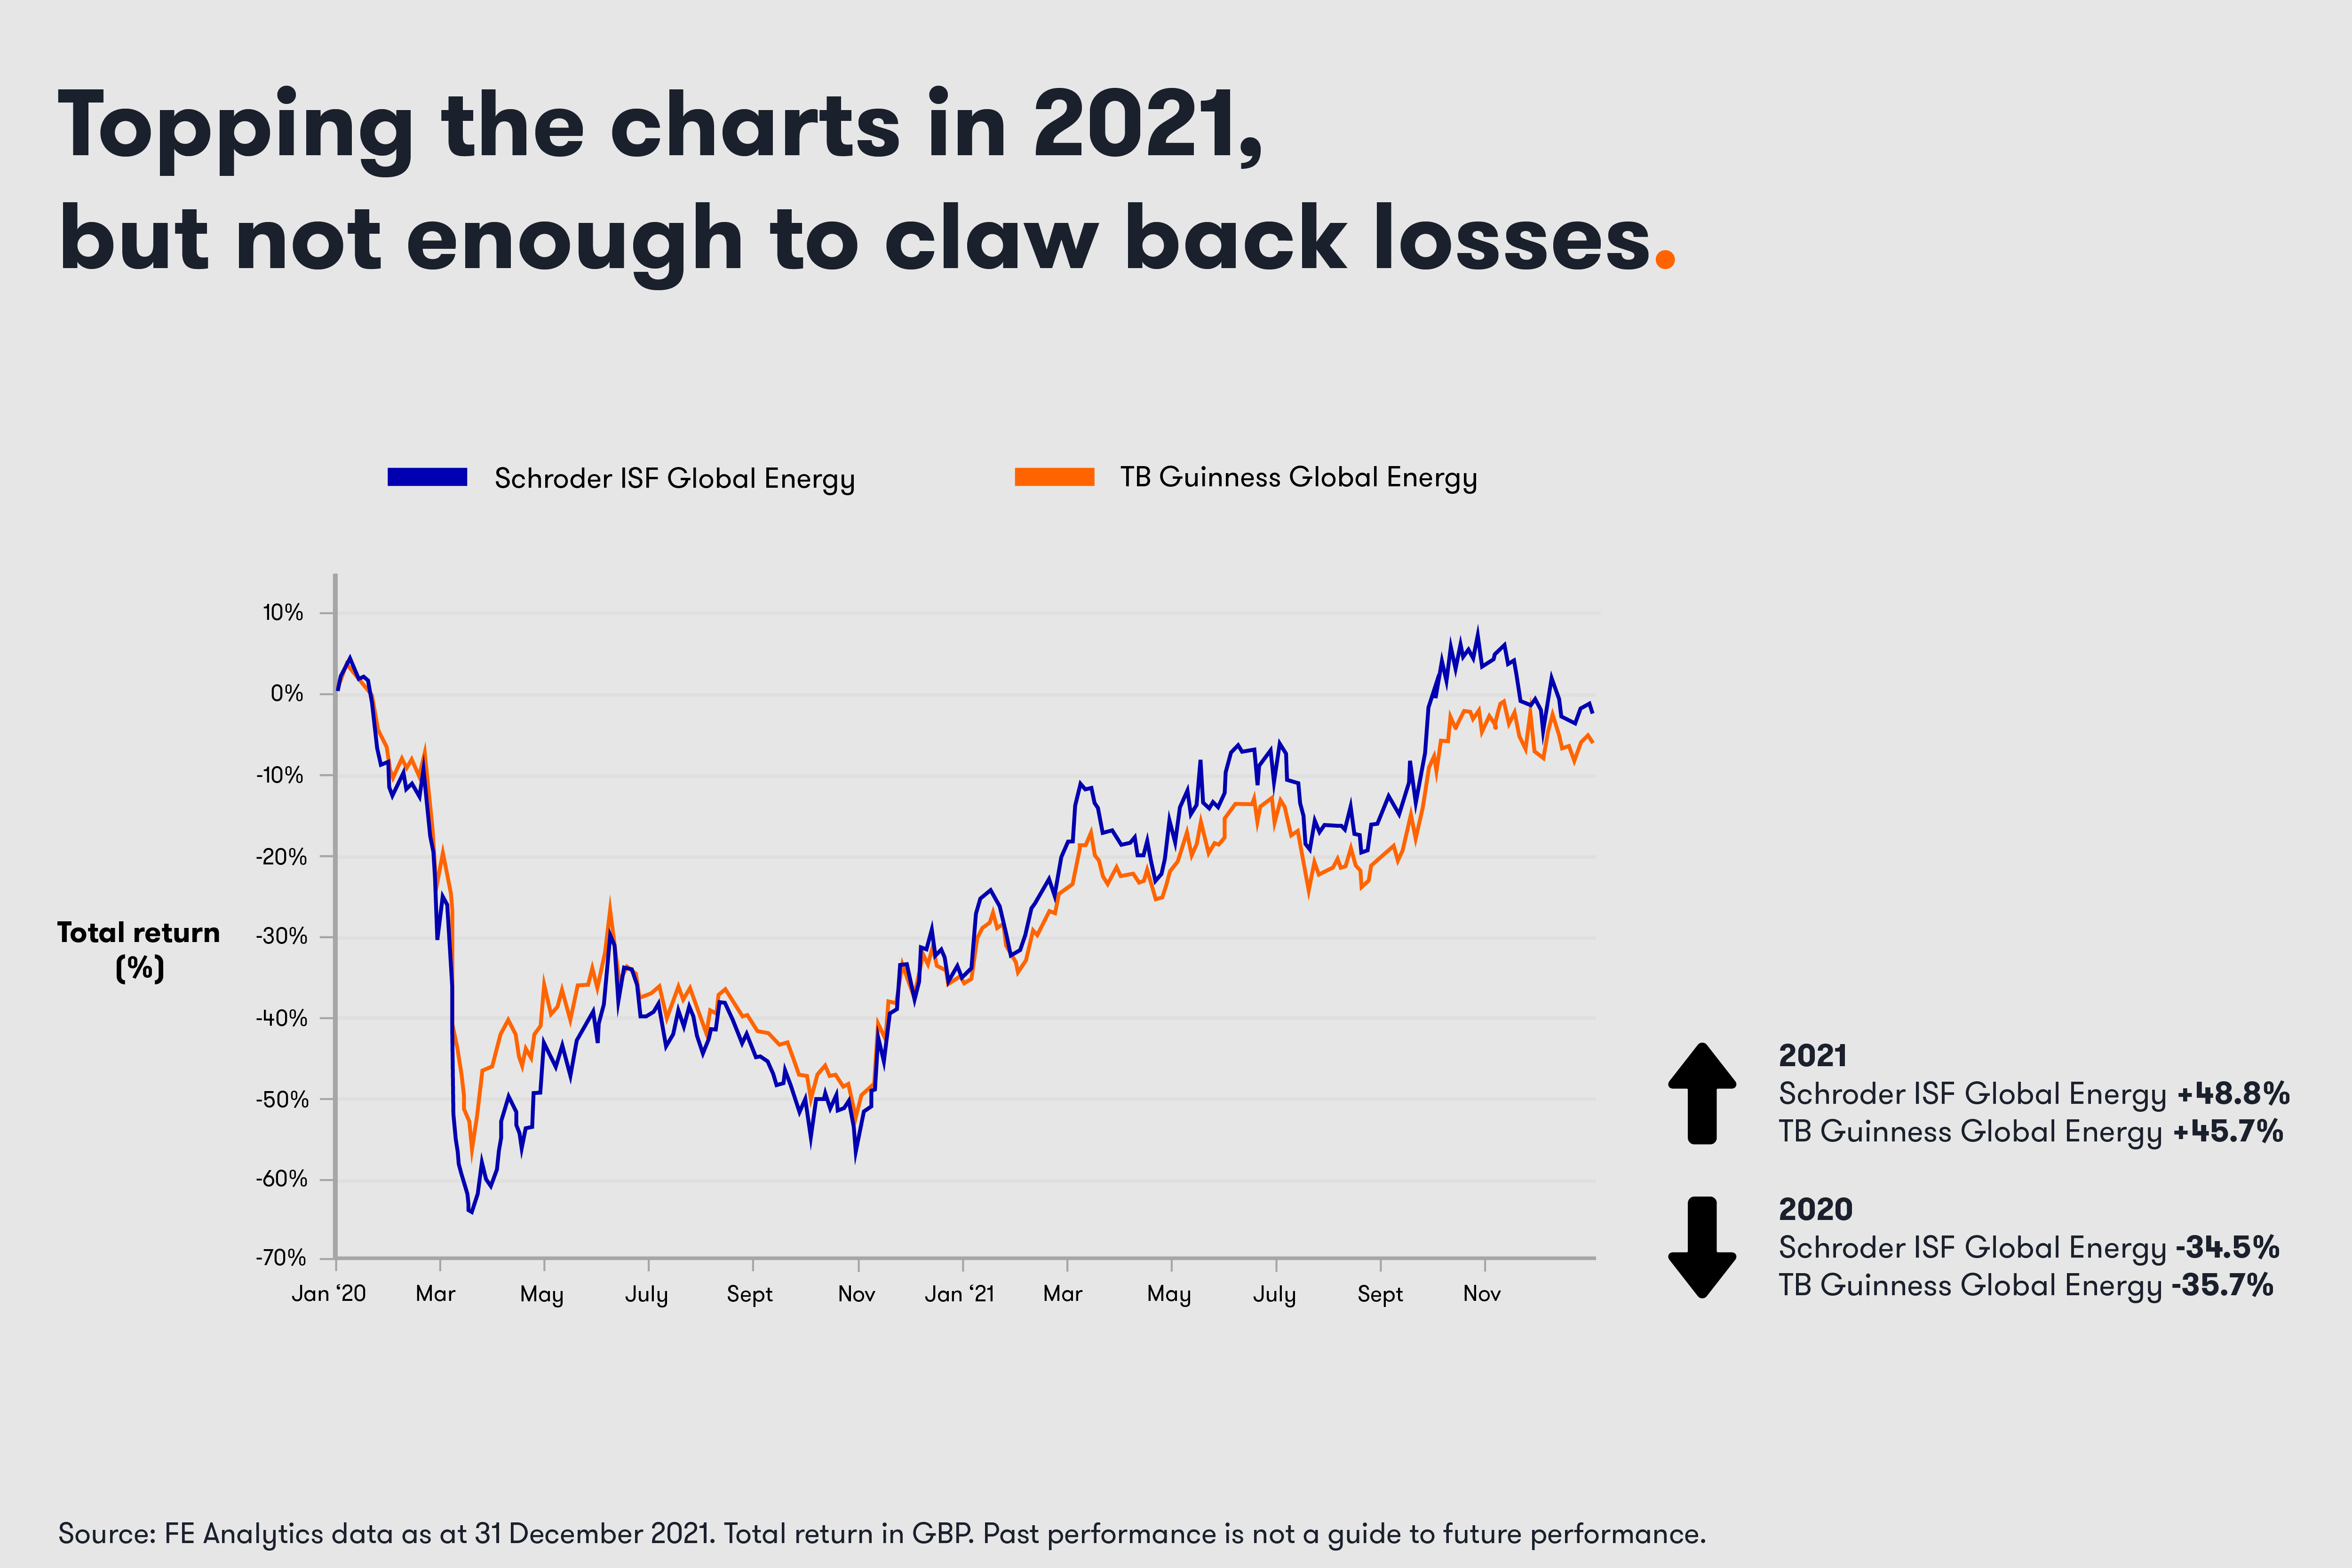
However, despite a strong showing in 2021 such funds were not able to recoup the losses they made in 2020. Schroder ISF Global Energy lost 34.5% in 2020, before going on to be 2021’s best-performing fund, returning 48.8%. As the chart below shows, on a two-year time horizon it remains in the red, down 2.4%.
Similarly, TB Guinness Global Energy lost 35.7% in 2020, but then had a much better 2021, up 45.7%. Since the start of 2020, though, it is still in negative territory, down 6.3%.
The chart above is an example of the risks that are part and parcel of investing in a specialist fund. Such funds are much more volatile than a more conventional fund investing across the global equity markets. When such funds fall heavily, large losses are harder to recover from. For example, a loss of 10% requires a gain of 11% to break even; a loss of 20% requires a gain of 25%; a loss of 33% requires a gain of 50%; and a loss of 50% requires a gain of 100%.
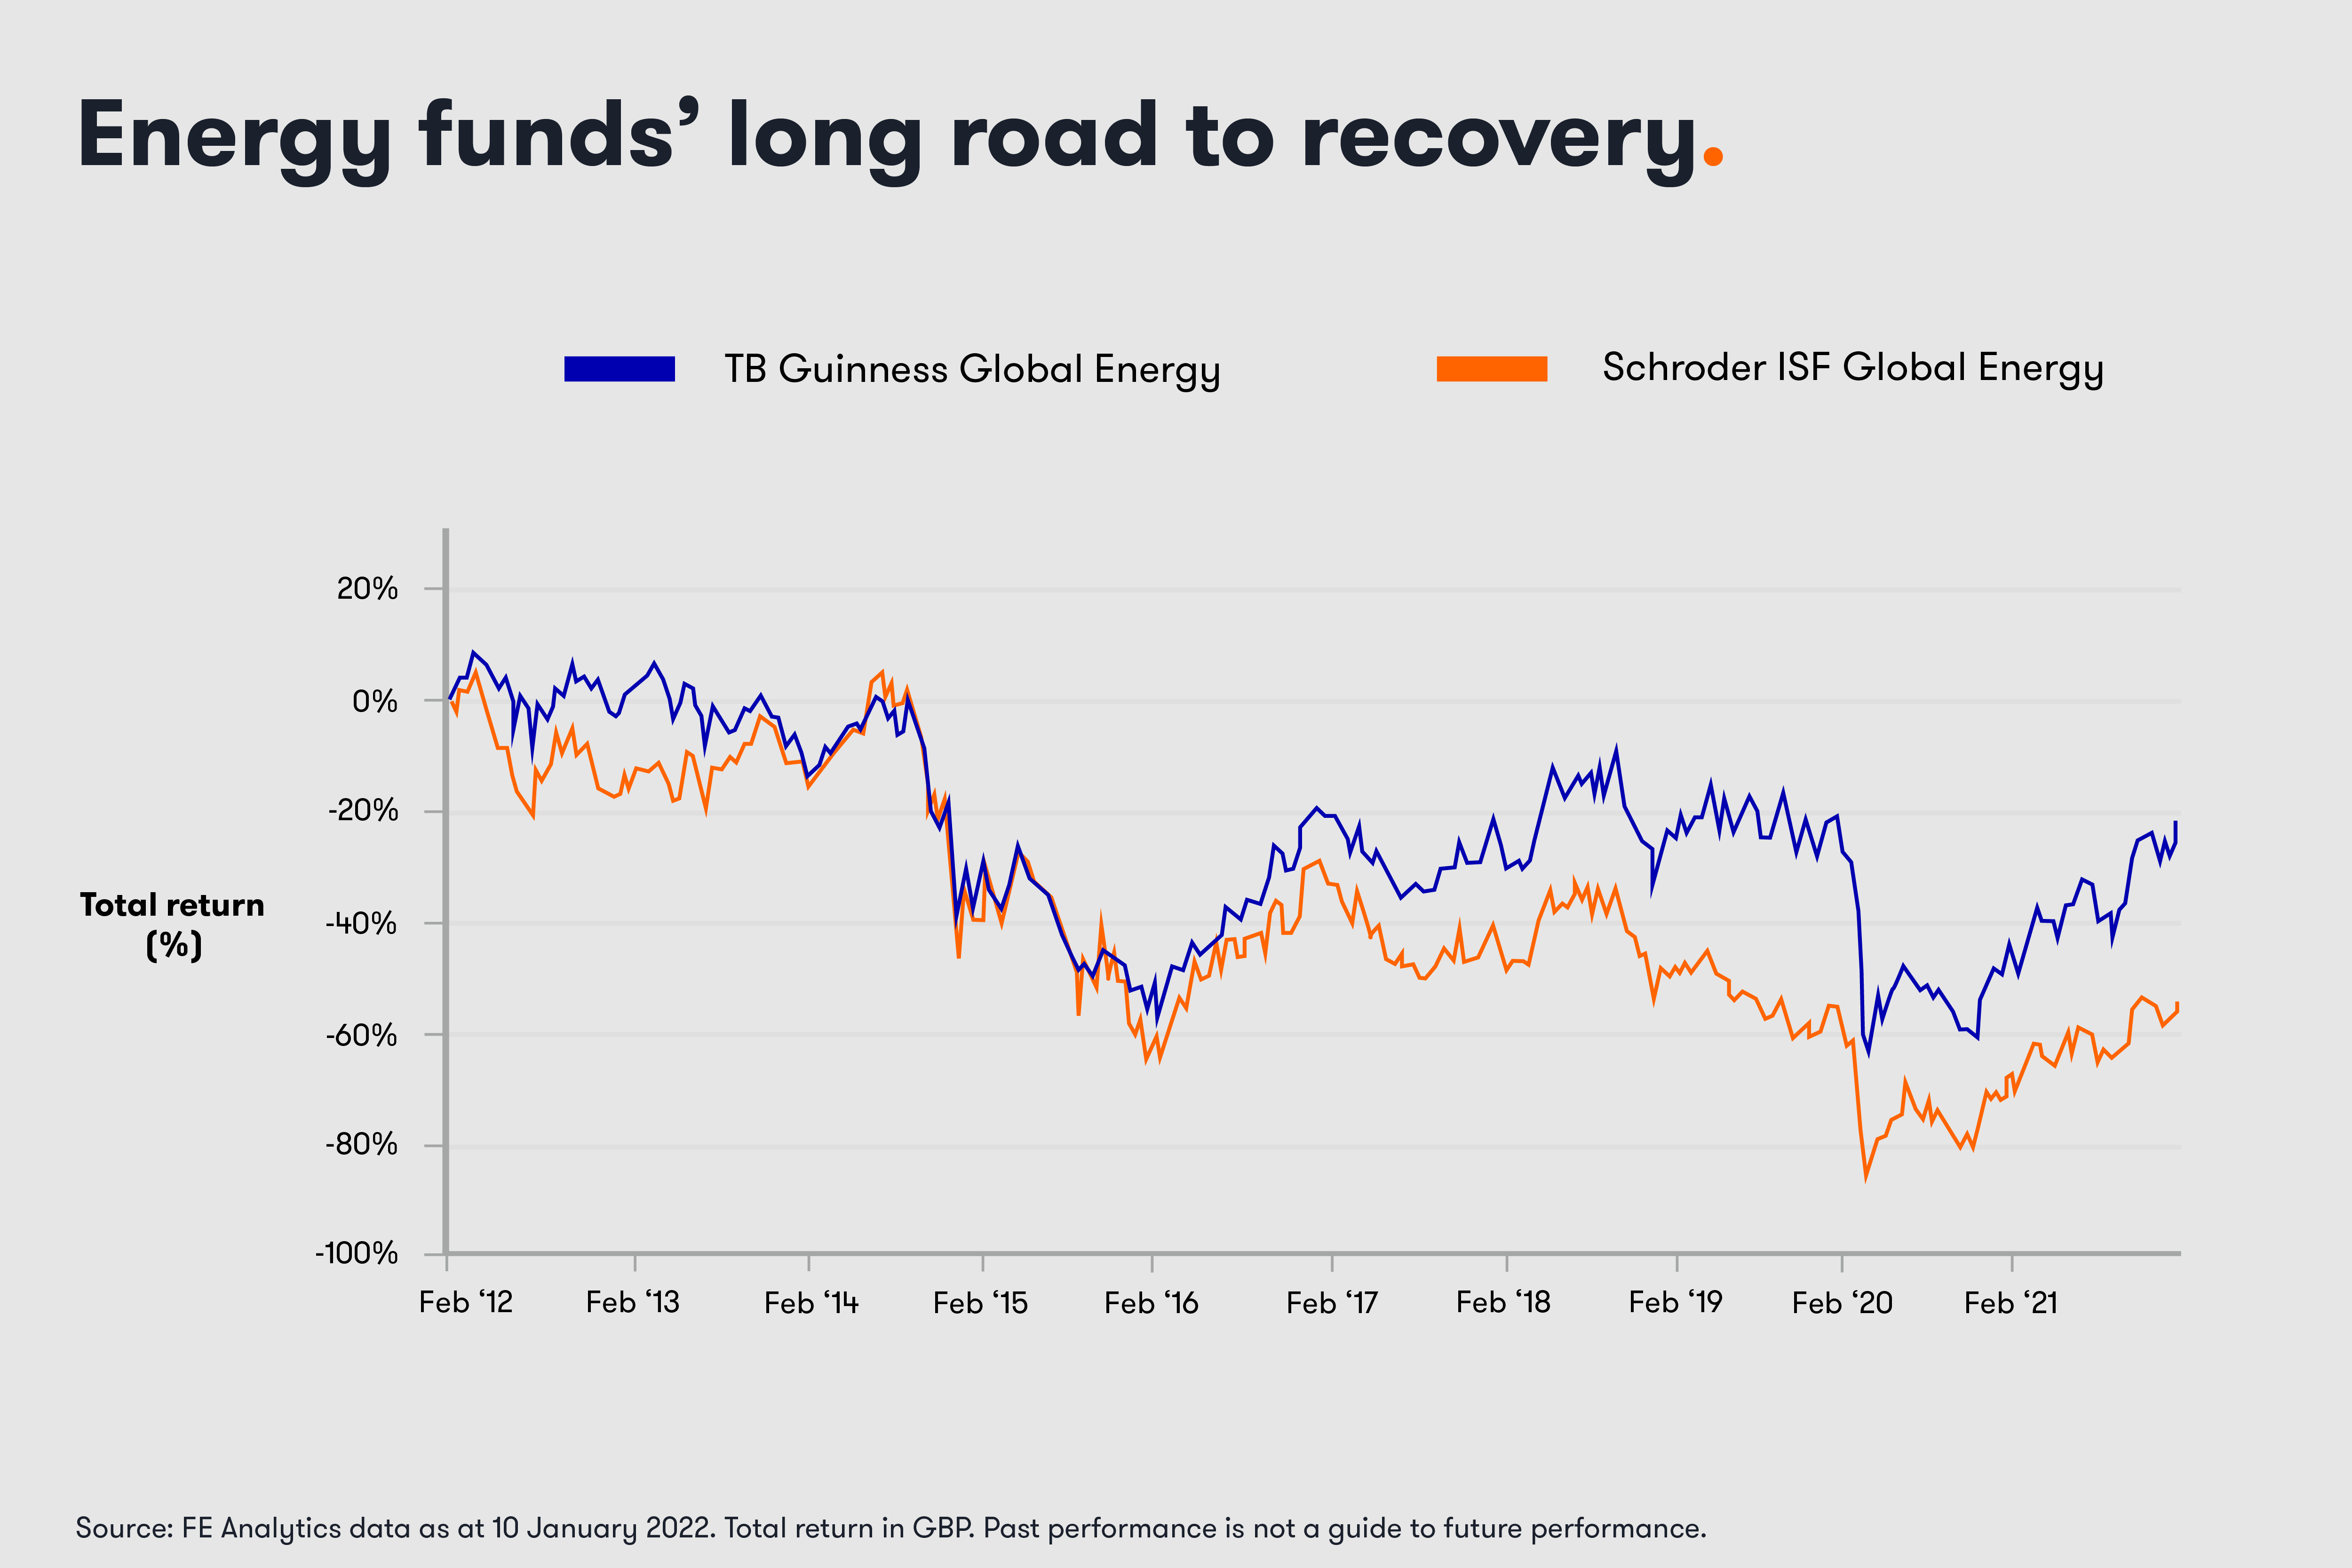
Over 10 years (from 10 January 2012 to 10 January 2022), the two funds have posted sizeable losses. As the chart below shows, the low point for Schroder ISF Global Energy was a loss of more than 80%, and for TB Guinness Global Energy the trough was a decline of around 60%. Therefore, as those are much bigger losses than in the two-year chart, they are harder to recover from. Over 10 years, Schroder ISF Global Energy is now showing a loss of 53.7% and TB Guinness Global Energy is down 21.6%.
The MSCI World Energy Index, which both funds use as a benchmark for their performance, is up 18.3% over the past 10 years in sterling terms.
The rewards and risks for getting it right or wrong are great. Two of the other main examples of specialist funds are those investing in biotech or commodities – investing across many or focusing on just one type, such as gold or oil.
In my view, with such funds, it is important to not simply ‘buy and hold’. Instead, be prepared to quit a losing position. If you buy at a bad time, it can be an uphill struggle to get back to even. Even if you time your entry well, keep a close eye on those paper gains and consider banking profits when sentiment swings back the other way. For investors willing to stomach the risk such funds should form only a small part of a diversified portfolio.
Specialist funds are a potential good fit for a core and satellite strategy, where most of a portfolio (70% to 80% typically) is invested in developed market equity funds. The remainder, the satellite part, is where investors can add some spice in racier, high-risk, but potentially high-reward, funds in the hope of generating higher growth.
These articles are provided for information purposes only. Occasionally, an opinion about whether to buy or sell a specific investment may be provided by third parties. The content is not intended to be a personal recommendation to buy or sell any financial instrument or product, or to adopt any investment strategy as it is not provided based on an assessment of your investing knowledge and experience, your financial situation or your investment objectives. The value of your investments, and the income derived from them, may go down as well as up. You may not get back all the money that you invest. The investments referred to in this article may not be suitable for all investors, and if in doubt, an investor should seek advice from a qualified investment adviser.
Full performance can be found on the company or index summary page on the interactive investor website. Simply click on the company's or index name highlighted in the article.