Lloyds Bank shares could double in this scenario
5th July 2021 08:14
by Alistair Strang from interactive investor
This analyst names the price level Lloyds’ shares absolutely must exceed if the price is to break free of its lethargic 18 months.

Of all the trite sayings attributed to the stock market, “the trend is your friend” is probably the most annoying. Just what is a trend? Is it a line on a chart? If so, what line? Or is it something to do with the share price, in relation to whatever it used to be? Perhaps it’s something to do with the media and their unfortunate habit of assigning “Strong Buy” or “Strong Sell” against a share price.
It’s all important, it’s all nonsense, and it’s all hitting us every day. Currently, Lloyds Bank (LSE:LLOY) presents a perfect ‘case in point’.
- Invest with ii: Top UK Shares | Share Prices Today | Open a Trading Account
The big chart from 2012 (below) suggests utter panic should Lloyds find sufficient excuse to slither below the 24p level, represented by a big Red line. From our perspective, this makes some sense as it produces a picture where Lloyds risks bottoming at 6p or so.
- Why reading charts can help you become a better investor
- Check out our award-winning stocks and shares ISA
In an easy summary, the share price needs to halve before panic ensues but, to be fair, the way the market works, it wouldn’t exactly surprise us if the share dipped below 24p in an opening second movement, triggering a load of stop-loss levels, and then produced a miracle bounce anyway.
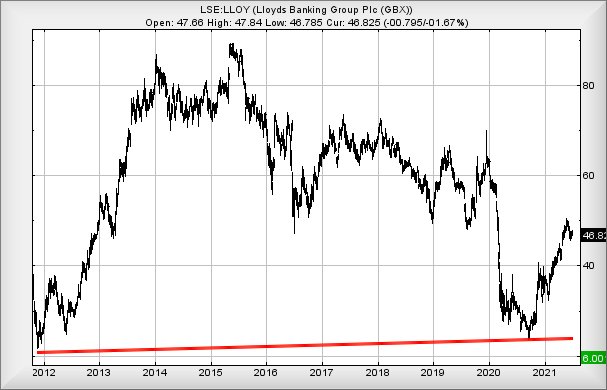
Source: Trends and Targets. Past performance is not a guide to future performance
Then, there’s another trend line, one since the lows of 2020. Presently, this adornment lurks at roughly 42p, which the bank’s share price is safely above.
Perhaps we should talk about the 2021 trend, starting from a low of 33p. Currently, this ad hoc line lurks at 46p, dangerously close to the current price level of 47p.
Which trend should be watched?
From our perspective, focused on numbers, the answer is pretty simple. None of them…
Lloyds’ share price needs to slink below 44p to force raised eyebrows, this suggesting some weakness has entered calculations with the share trading at lower levels, since the market opted to “gap” the price up in April.
Initially, we’d be looking for a phoney bounce at 42p before the share found a bottom level at around 39.5p. Absent from this tier of calculations is any form of trend line. Prices go up and down with movement since the pandemic hit, tending to suggest painting a line on a chart will provide little clue.
Instead, it’s worth reviewing historical movements in relation to these calculated target levels, just to see if they make any sort of visual sense. In the case of 39.5p as a potential bounce point, price shuffles in 2021, and again at the end of 2020, tend suggest it’s worth paying attention to, if it even appears.
- Why Lloyds Bank and FTSE 100 are at a critical juncture
- Lloyds and the other UK banks investors should be buying
- Explore more video content on our YouTube channel
Please remember, we are describing a movement scenario, attempting to wrap it up in writing what makes sense. At the very minimum, there is a gap (circled) at 42p, one which the gullible will be inclined to believe another trite market saying - “gaps are always covered.” They are not. And if they are, the movement is rarely exact.
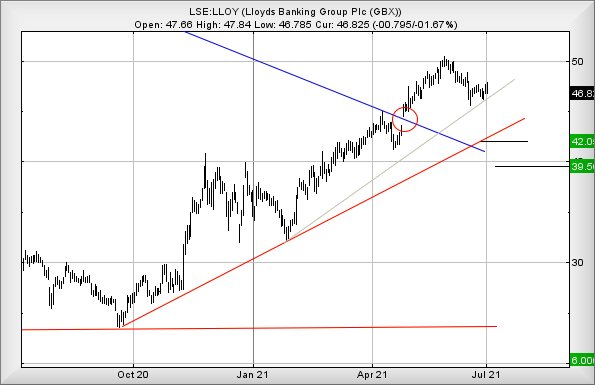
Source: Trends and Targets. Past performance is not a guide to future performance
We write about Lloyds’ share price every three weeks, generally expressing considerable frustration at the lack of movement. For the present, we’re supposed to be interested in a trading range of just 2p since last time we put pen to paper.
This isn’t an encouraging state of affairs, but to return again to the circled area on the chart at 42p at the end of April, there’s little doubt the market opted to manipulate the share price higher, above the immediate Blue downtrend. In a normal world, this should provide a pretty solid indication of coming growth, a substantial clue being the market opting to remove the share price from a downtrend.
At this stage, we’d ordinarily be persuading folk to look for “higher highs,” but thanks to the gap, the price is already substantially above all the highs before the trend break. As a result, we’re inclined to invent a price level the share absolutely must exceed if the price intends to break free of its lethargic 18 months.
In the case of Lloyds, only above 51.5p shall convince us some solid movement is upon us, calculating with an initial ambition of 56.5p. If exceeded, our longer-term secondary comes along at 66p and visually matches the share price highs, pre-Covid. Once this milestone is attained, it shall be worth paying close attention to the point at which the share price actually closes a session. In the event of closure above just 67p, the value enters the land of “Higher Highs” again, providing an astounding 92p as a viable longer-term hope.
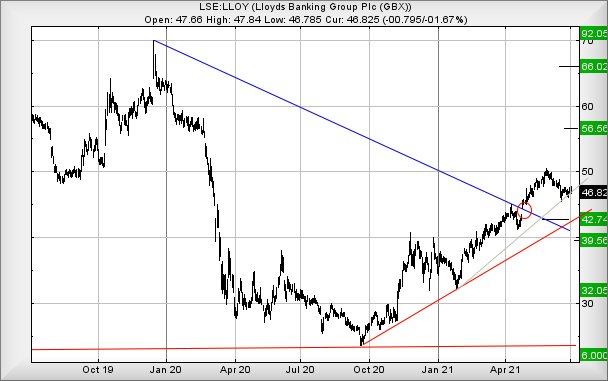
Source: Trends and Targets. Past performance is not a guide to future performance
Alistair Strang has led high-profile and "top secret" software projects since the late 1970s and won the original John Logie Baird Award for inventors and innovators. After the financial crash, he wanted to know "how it worked" with a view to mimicking existing trading formulas and predicting what was coming next. His results speak for themselves as he continually refines the methodology.
Alistair Strang is a freelance contributor and not a direct employee of Interactive Investor. All correspondence is with Alistair Strang, who for these purposes is deemed a third-party supplier. Buying, selling and investing in shares is not without risk. Market and company movement will affect your performance and you may get back less than you invest. Neither Alistair Strang or Interactive Investor will be responsible for any losses that may be incurred as a result of following a trading idea.
These articles are provided for information purposes only. Occasionally, an opinion about whether to buy or sell a specific investment may be provided by third parties. The content is not intended to be a personal recommendation to buy or sell any financial instrument or product, or to adopt any investment strategy as it is not provided based on an assessment of your investing knowledge and experience, your financial situation or your investment objectives. The value of your investments, and the income derived from them, may go down as well as up. You may not get back all the money that you invest. The investments referred to in this article may not be suitable for all investors, and if in doubt, an investor should seek advice from a qualified investment adviser.
Full performance can be found on the company or index summary page on the interactive investor website. Simply click on the company's or index name highlighted in the article.