Lloyds shares: more glimmer of hope to come?
Lloyds’s share price potentials met our chartist’s criteria last time. Can it do the same again?
26th October 2020 09:41
by Alistair Strang from Trends and Targets
The retail bank’s share price potentials met our chartist’s criteria last time. Can it do the same again?

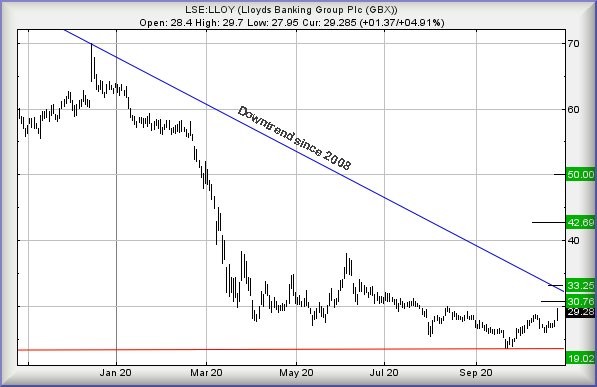
Lloyds Banking Group (LSE:LLOY)
Life comes at you fast - unless you are watching banking shares!
We started this month, mentioning Lloyds Banking Group (LSE:LLOY) were starting to show glimmers of hope for the future and it was to take three weeks before such blind optimism was proven correct.
In normal times, we'd now be pretty comfortable the share price was about to start a recovery cycle.
- Lloyds Banking Group: are we about to see a turnaround?
- Why reading charts can help you become a better investor
One of the key criteria given three weeks ago was the need for Lloyds’ share price to rise above 29.6p as this should prove we're competent with our reading of the tea leaves.
In fact, the market generously allowed Lloyds to reach 29.7p on 23 October, thankfully reaching such an impossible high during the trading day rather than as one of these frustrating spikes in the opening second.
To us, this is fairly important as it implies honest trading has caused the rise, rather than market price manipulation designed to give hope which will vanish faster than sunshine in Scotland.
The immediate situation now looks like movements above 29.7p should bring a visit to 30.75p with secondary, if bettered, calculating up at 33.25p.
Visually, there's quite a lot of importance attached to the 30.75p level as this should hopefully permit the share price to actually close a session above the glass ceiling which has formed at 30p.
The surprise with our secondary of 33.25p comes from the blue line on the chart.
This represents the downtrend since 2008 and is almost certain to provoke an excuse for hesitation in Lloyds’ recovery.
With closure above this trend line it feels inevitable a new trend shall start to form, one with 50p suggesting itself as a fairly sane ambition for the future.
Lloyds would now need to weaken below red on the chart, currently at 24p, to signal trouble.
A calamity such as this would point at reversal to 19p and hopefully a final bottom.
The picture presented by recent share price dance steps tend to suggest this unlikely.
Source: Trends and Targets Past performance is not a guide to future performance
Alistair Strang has led high-profile and "top secret" software projects since the late 1970s and won the original John Logie Baird Award for inventors and innovators. After the financial crash, he wanted to know "how it worked" with a view to mimicking existing trading formulas and predicting what was coming next. His results speak for themselves as he continually refines the methodology.
Alistair Strang is a freelance contributor and not a direct employee of Interactive Investor. All correspondence is with Alistair Strang, who for these purposes is deemed a third-party supplier. Buying, selling and investing in shares is not without risk. Market and company movement will affect your performance and you may get back less than you invest. Neither Alistair Strang or Interactive Investor will be responsible for any losses that may be incurred as a result of following a trading idea.
These articles are provided for information purposes only. Occasionally, an opinion about whether to buy or sell a specific investment may be provided by third parties. The content is not intended to be a personal recommendation to buy or sell any financial instrument or product, or to adopt any investment strategy as it is not provided based on an assessment of your investing knowledge and experience, your financial situation or your investment objectives. The value of your investments, and the income derived from them, may go down as well as up. You may not get back all the money that you invest. The investments referred to in this article may not be suitable for all investors, and if in doubt, an investor should seek advice from a qualified investment adviser.
Full performance can be found on the company or index summary page on the interactive investor website. Simply click on the company's or index name highlighted in the article.