Rentokil Initial shares just got very interesting
15th December 2021 07:56
by Alistair Strang from Trends and Targets
A $6.7 billion cash and shares takeover of its big US rival has been badly received, but independent analyst Alistair Strang looks past the immediate reaction to the longer term potential.

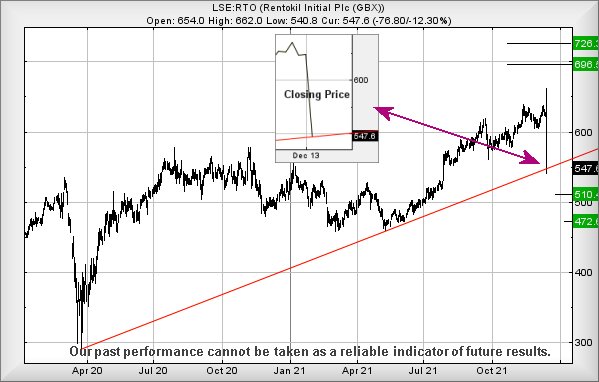
Rentokil Initial's (LSE:RTO) share price movements on 14 December starkly illustrate the ‘market truism’, “Buy on the rumour, Sell on the news!”. Ending the day down 12%, the company announced they had become the largest Pest Control company in the world, taking over US company Terminex. With depressing inevitability, the eventual reversal to end the day down was attributed to the terms of the deal but we’re not sold on this concept.
We can be cynical, due to the price level the share closed the day at (547.6p), along with a simple calculation to discover the exact, immediate, level of the Red line. It works out the share price was required to close the day below 547.485p to successfully break Red. By an amazing stroke of luck (?), the share price ended the session 12/100th of a penny above the trend, presumably in safety and a point at which we may hope for a bounce.
- Friends & Family: ii customers can give up to 5 people a free subscription to ii, for just £5 a month extra. Learn more
- Why reading charts can help you become a better investor
From a near-term perspective, the share price needs to exceed 582p to trigger a prospective early warning signal. Recovery such as this allows for an initial 612p but, should a reason be discovered to trade above 612p, things are liable to become interesting for the longer term, calculating with the suggestion of ongoing growth to 696p with secondary, if bettered, at 726p and a very probable point of hesitation.
Source: Trends and Targets. Past performance is not a guide to future performance
When we examine the potentials, should a reversal scenario occur, the price looks like it actually needs below 533p to provoke a serious trigger, one which calculates as capable of bringing further slumps to 510p initially. Should such a level break, we can work out a secondary at 472p, a share price level which suggests a bounce can be hoped for.
In conclusion, the chart overall looks pretty positive and, while we’re perhaps grasping at straws with our observations on the company closing price for the 14th, there was clearly some sort of justification for the market ensuring the closing price didn’t break trend. Multiple experiences in the past tend to suggest this is something worth paying attention to.
Alistair Strang has led high-profile and "top secret" software projects since the late 1970s and won the original John Logie Baird Award for inventors and innovators. After the financial crash, he wanted to know "how it worked" with a view to mimicking existing trading formulas and predicting what was coming next. His results speak for themselves as he continually refines the methodology.
Alistair Strang is a freelance contributor and not a direct employee of Interactive Investor. All correspondence is with Alistair Strang, who for these purposes is deemed a third-party supplier. Buying, selling and investing in shares is not without risk. Market and company movement will affect your performance and you may get back less than you invest. Neither Alistair Strang or Interactive Investor will be responsible for any losses that may be incurred as a result of following a trading idea.
These articles are provided for information purposes only. Occasionally, an opinion about whether to buy or sell a specific investment may be provided by third parties. The content is not intended to be a personal recommendation to buy or sell any financial instrument or product, or to adopt any investment strategy as it is not provided based on an assessment of your investing knowledge and experience, your financial situation or your investment objectives. The value of your investments, and the income derived from them, may go down as well as up. You may not get back all the money that you invest. The investments referred to in this article may not be suitable for all investors, and if in doubt, an investor should seek advice from a qualified investment adviser.
Full performance can be found on the company or index summary page on the interactive investor website. Simply click on the company's or index name highlighted in the article.