Ripple makes waves – and the murky future for HSBC
Uncertainty surrounds both stocks, but the cryptocurrency has the potential to move faster.
18th May 2021 06:21
by Alistair Strang from Trends and Targets
Uncertainty surrounds both stocks, but the cryptocurrency has the potential to move faster.

Ripple & HSBC
Our interest in the Ripple (coin:XRPUSD) cryptocurrency is aroused due to the number of emails received regarding our thoughts for its future.
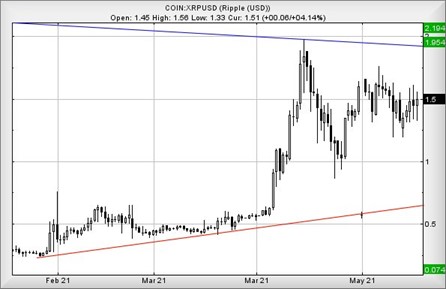
The immediate picture would be attractive if we were not discussing a cryptocurrency, as we don't trust their pricing across exchanges. For Ripple, presently trading around $1.513 (£1.06), it appears movement above $1.70 is almost certain to promote price growth toward an initial $1.95.
Should such a level be exceeded, we can calculate a secondary ambition which we'd usually refer to as 'longer-term' at $2.19.
Of course, as this is a cryptocurrency, longer-term can easily mean sometime in the next hour or so. When things get exciting, cryptocurrency moves pretty fast.
It's curious to note our ambition around the $1.95 level coincides with a blue downtrend line, a feature in price movements which dates back to 2018. Common sense tends suggest expecting some price hesitation at such a level, especially as it almost matches the prior highs from April this year.
- Scottish Mortgage dips its toes into cryptocurrency
- ii view: HSBC happy with good start to the year
- Why reading charts can help you become a better investor
Only if Ripple tends to trade below $0.86 would we now be inclined to panic, as the reversal threat to $0.07 is quite hideous. To be fair, we suspect the red line on the chart would intrude as we're not the only folk capable of drawing straight lines.
Source: Trends and Targets. Past performance is not a guide to future performance
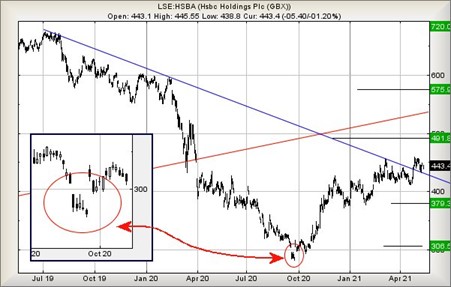
When we last reviewed HSBC Holdings (LSE:HSBA) in 2020 we quite gloomily projected the threat of a bottom at 302p.
We were feeling quite smug about our prediction until 21 September, when the market opted to gap (manipulate) the price below our target (circled below). Just four days later, the market opted to gap the price above our target level.
How we chuckled as the price was gapped down, then gapped up. This piece of insanity will often be the precursor for a period of strength and, in the case of HSBC, the share price rose steadily from 302p up to 450p.
To be honest, we've been unable to produce a reliable map for this behaviour, due to these price gaps giving a period where the share has moved without trades. This makes our usual progression formula uncertain. As everyone learns, you can multiply zero by a million and the answer is still zero. Perhaps this alone provides a reason for this type of market behaviour.
The situation now with HSBC suggests growth next exceeding 459p should aim for an initial 491p. With closure above this point, our longer-term secondary calculates at a confident-looking 575p.
Should HSBC decide to explore the u-bend in the toilet of share prices, it needs to drop below 410p to suggest panic, as this threatens reversal to an initial 379p. If broken, our secondary is at 306p and an almost certain bottom.
Source: Trends and Targets. Past performance is not a guide to future performance
Alistair Strang has led high-profile and "top secret" software projects since the late 1970s and won the original John Logie Baird Award for inventors and innovators. After the financial crash, he wanted to know "how it worked" with a view to mimicking existing trading formulas and predicting what was coming next. His results speak for themselves as he continually refines the methodology.
Alistair Strang is a freelance contributor and not a direct employee of Interactive Investor. All correspondence is with Alistair Strang, who for these purposes is deemed a third-party supplier. Buying, selling and investing in shares is not without risk. Market and company movement will affect your performance and you may get back less than you invest. Neither Alistair Strang or Interactive Investor will be responsible for any losses that may be incurred as a result of following a trading idea.
These articles are provided for information purposes only. Occasionally, an opinion about whether to buy or sell a specific investment may be provided by third parties. The content is not intended to be a personal recommendation to buy or sell any financial instrument or product, or to adopt any investment strategy as it is not provided based on an assessment of your investing knowledge and experience, your financial situation or your investment objectives. The value of your investments, and the income derived from them, may go down as well as up. You may not get back all the money that you invest. The investments referred to in this article may not be suitable for all investors, and if in doubt, an investor should seek advice from a qualified investment adviser.
Full performance can be found on the company or index summary page on the interactive investor website. Simply click on the company's or index name highlighted in the article.