Royal Bank of Scotland shares: Prospects for 2020
Already experiencing post-election blues, our chartist looks at the probability of new trends beginning.
19th December 2019 08:52
by Alistair Strang from Trends and Targets
Already experiencing post-election blues, our chartist looks at the probability of new trends beginning.

Royal Bank of Scotland (LSE:RBS)
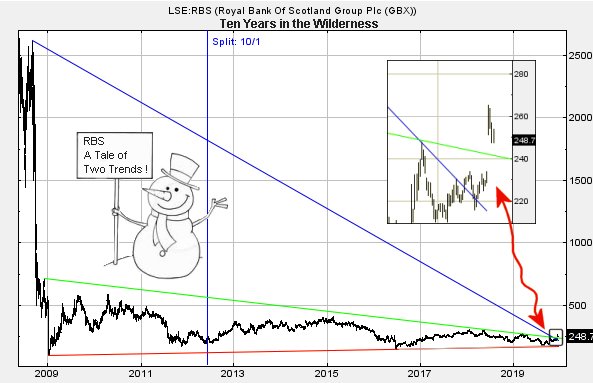
It took the Conservative win in the General Election to "prove" we've been studiously following the wrong trend against Royal Bank of Scotland (LSE:RBS). Often, a market gap such as occurred after the election will do two useful things.
First, it confirms the prior trend position and, secondly, it confirms a new trend commencing. And third, perhaps the most important detail, we've now got an early warning danger level, if the price intends serious reversal.
Source: Trends and Targets Past performance is not a guide to future performance
In the grand scheme of things, the trend in blue on the chart inset has turned out to be a load of tosh, the price movement signalling we should really have been watching the green trend line!
Both trends commenced from 2008, the Blue one from an adjusted high of 26 quid, the green one from an adjusted high of just seven quid. The implication behind this difference is foul, suggesting we must dilute long term big picture ambitions.
- Royal Bank of Scotland shares: Time to start celebrating?
- Best stocks to own after the General Election
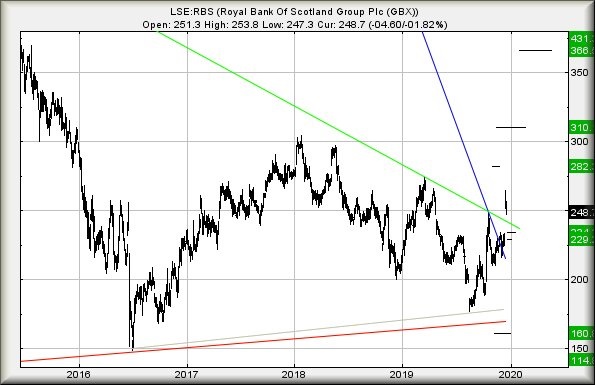
To look at the positive side of things, should RBS now manage to stagger above 265p, we're looking for ongoing recovery to an initial 282p.
If exceeded, our secondary calculation works out at 310p. As it's the festive season, we decided to run the numbers on the basis 310p is somehow exceeded.
Apparently, 431p becomes a major point of interest, a price level where some real volatility could be expected.
Curiously, this level virtually matches the high of 2015, along with a funny period in 2011 when something strange was going on with the share. In plain English, in the (unlikely at present) event 431p makes an appearance, we'd expect trouble.
The immediate future does not look like a miracle recovery is planned. Instead, we'll be interested if the share staggers below 246p as reversal down to 234p makes a lot of sense. If broken, secondary comes in at 229p.
Despite these calculations bringing the share price below green again, we shall not be terribly alarmed unless the market opts to gap the price down below the trend. We keep banging on about this sort of thing as it's a prime indication the market feels the recent breakout was erroneous.
In the case of RBS, were the price now to be gapped down below 242p, the big picture allows reversal to 160p, perhaps even a bottom of 114p.
We need to stress, if the share trades downward without market manipulation gaps, we shall not be alarmed and suggest patience while awaiting a future break upward.
Thankfully, this should be the final time we cover RBS this decade. But shall revisit toward end of January next year.
Source: Trends and Targets Past performance is not a guide to future performance
Alistair Strang has led high-profile and "top secret" software projects since the late 1970s and won the original John Logie Baird Award for inventors and innovators. After the financial crash, he wanted to know "how it worked" with a view to mimicking existing trading formulas and predicting what was coming next. His results speak for themselves as he continually refines the methodology.
Alistair Strang is a freelance contributor and not a direct employee of Interactive Investor. All correspondence is with Alistair Strang, who for these purposes is deemed a third-party supplier. Buying, selling and investing in shares is not without risk. Market and company movement will affect your performance and you may get back less than you invest. Neither Alistair Strang, or interactive investor will be responsible for any losses that may be incurred as a result of following a trading idea.
Alistair Strang has led high-profile and "top secret" software projects since the late 1970s and won the original John Logie Baird Award for inventors and innovators. After the financial crash, he wanted to know "how it worked" with a view to mimicking existing trading formulas and predicting what was coming next. His results speak for themselves as he continually refines the methodology.
Alistair Strang is a freelance contributor and not a direct employee of Interactive Investor. All correspondence is with Alistair Strang, who for these purposes is deemed a third-party supplier. Buying, selling and investing in shares is not without risk. Market and company movement will affect your performance and you may get back less than you invest. Neither Alistair Strang or Interactive Investor will be responsible for any losses that may be incurred as a result of following a trading idea.
These articles are provided for information purposes only. Occasionally, an opinion about whether to buy or sell a specific investment may be provided by third parties. The content is not intended to be a personal recommendation to buy or sell any financial instrument or product, or to adopt any investment strategy as it is not provided based on an assessment of your investing knowledge and experience, your financial situation or your investment objectives. The value of your investments, and the income derived from them, may go down as well as up. You may not get back all the money that you invest. The investments referred to in this article may not be suitable for all investors, and if in doubt, an investor should seek advice from a qualified investment adviser.
Full performance can be found on the company or index summary page on the interactive investor website. Simply click on the company's or index name highlighted in the article.