Stocks could be headed for a new bull market
3rd February 2023 17:04
by Russell Burns from Finimize
Inflation and recession risks battered the market in 2022, but stocks are punching back. Question now is whether last year’s risks are truly behind us and whether we could be headed for a new bull market.

Inflation and recession risks battered the market in 2022. But already this year, stocks are punching back, with growth and technology shares flexing some serious muscle. Tesla (NASDAQ:TSLA) has rallied 44%, Shopify (NYSE:SHOP) 44%, Meta Platforms (NASDAQ:META) 23%, and Amazon.com (NASDAQ:AMZN) 20%. The question now is whether last year’s risks are truly behind us and whether we could be headed for a new bull market. Let’s take a look…
So, where do we stand with those risks?
Last year, valuations of long-duration assets – think Treasury bonds, and growth and technology stocks – were hammered by higher interest rates. And it was no wonder: the present value of their cash flows fell sharply as interest rates shot higher.
So far in 2023, we’ve seen the reverse – stocks and bonds have both been rallying, with investors expecting lower inflation rates to lead to lower interest rates.
As Blackstone, the world’s biggest alternative asset manager, pointed out recently, the Federal Reserve’s benchmark interest rates (i.e. the fed funds rates) always exceed the rate of inflation before the hiking cycle ends. We’ve now reached that threshold: for the first time since February 2020, those interest rates are higher than the rate of inflation – as measured by the core personal consumption expenditure (PCE) price index, the Fed’s preferred price gauge.
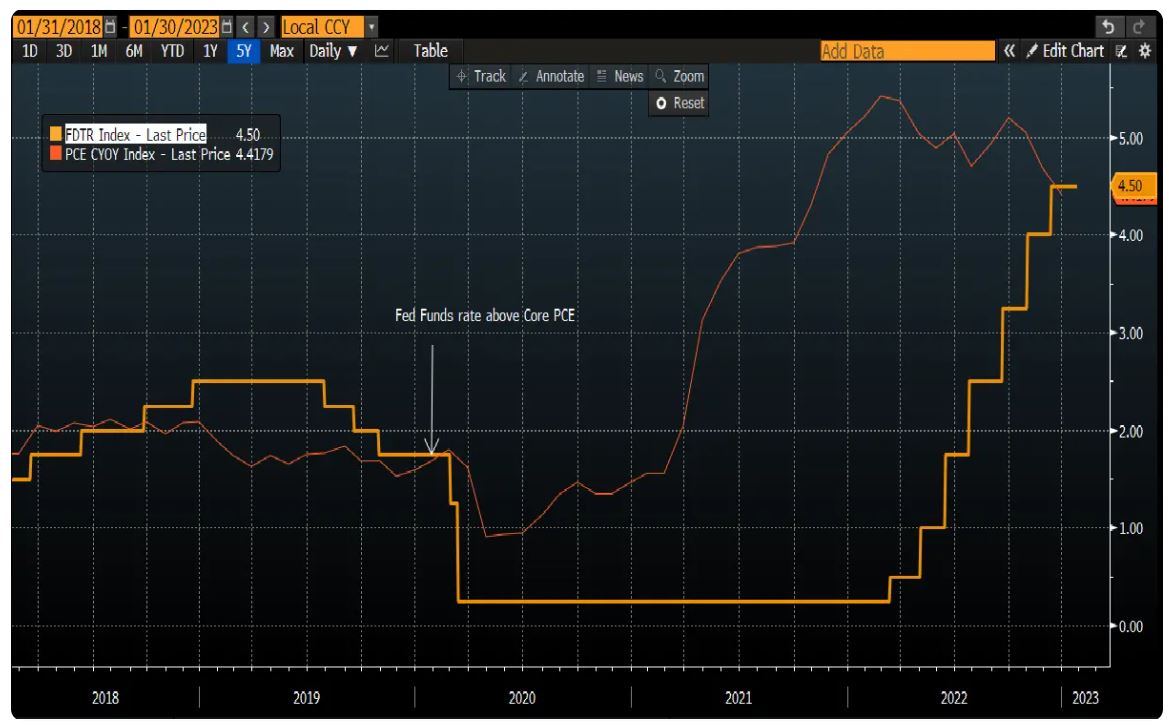
Fed funds rate and the core personal consumption expenditure index, yearly rate. Source: Bloomberg.
See, the Fed gradually raised its key rates (orange line) to a high of 4.5% last year as it sought to tamp down the hottest inflation seen in the States in over 40 years. And it’s expected to announce another 0.25 percentage point increase this week. Meanwhile, the rate of inflation has been falling. Core PCE (red line) dropped to a yearly pace of 4.4% in December.
Real rates are said to be positive when the interest rate is higher than the inflation rate (i.e. when your return after inflation is positive). And that’s what the Fed wants: an interest rate that’s higher than inflation means monetary policy is getting tighter, slowing economic growth and bringing inflation down back toward its longer-term 2% target.
So, how long till we get to that target?
Goldman Sachs expects core PCE inflation to fall further – to 2.9% by the end of the year. And that’s still high, but it’s a big move in the right direction. To get there, Goldman sees the Fed hiking rates again, by 0.25 percentage points in February, March, and May, bringing the key rate to a high of 5.25%.
Of course, not everyone agrees: some say the Fed’s done as many hikes as it needs to, and the recent slowdown in inflation suggests it could even be able to cut interest rates this year. That’d be great for stocks and is one reason why we have seen a sharp rally in tech shares this year.
Goldman is more bullish on the economy than most banks on Wall Street. One reason is the “time lag” between the timing of an interest rate hike and the actual impact on economic growth. No one knows exactly how long it takes for an economy to feel the full brunt of a rate increase, and Goldman figures it’s probably not as long as people think. Therefore, the investment bank says, the economic impact of the rate hikes from the first half of last year is probably peaking around now, and a recovery is probably going to happen in the second half of this year. In other words, Goldman sees the US economy avoiding a recession and enjoying a soft landing, an outcome that seemed all but impossible in the last quarter of 2022.
What’s the opportunity here?
Well, the rally we’ve seen in stocks so far this year seems to be pricing in a happy outcome for the economy and markets. But we’ve also seen some important positive technical signals in both the S&P 500 Index and the Nasdaq 100 Index.
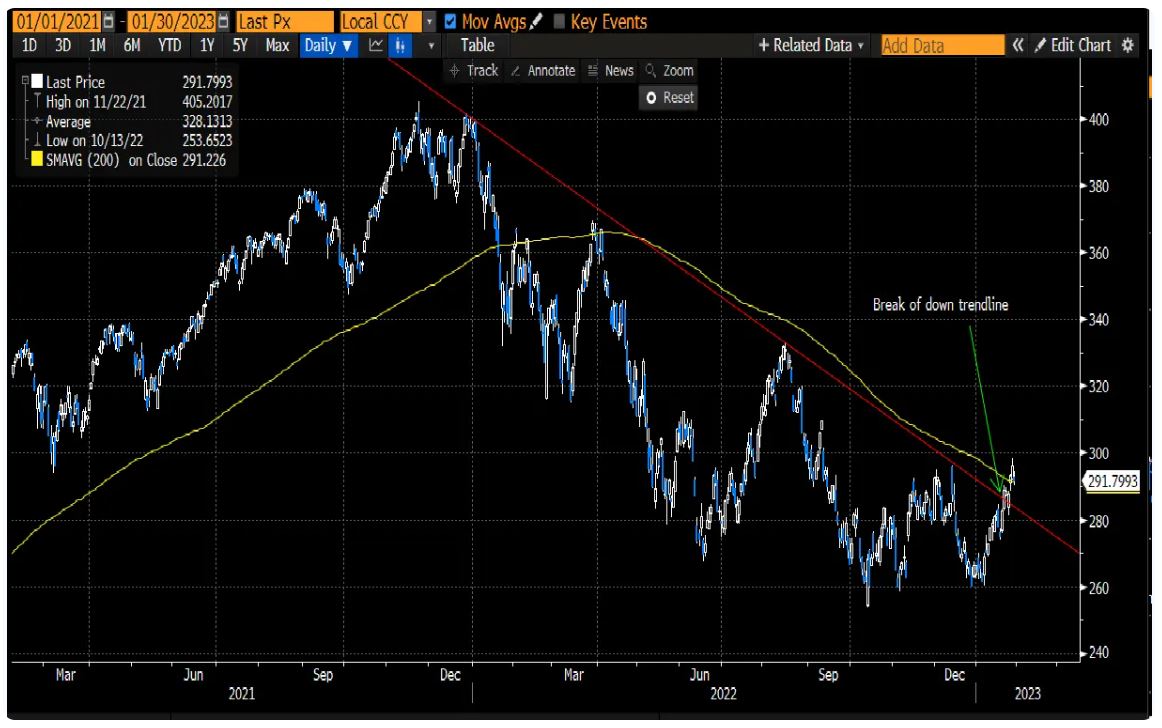
Nasdaq 100 ETF: 200-day moving average and trend line break. Source: Bloomberg.
Last week the Invesco Nasdaq 100 ETF broke above the downward trend (red line) that had been in place since January of 2022, and closed above the 200-day simple moving average (yellow line).
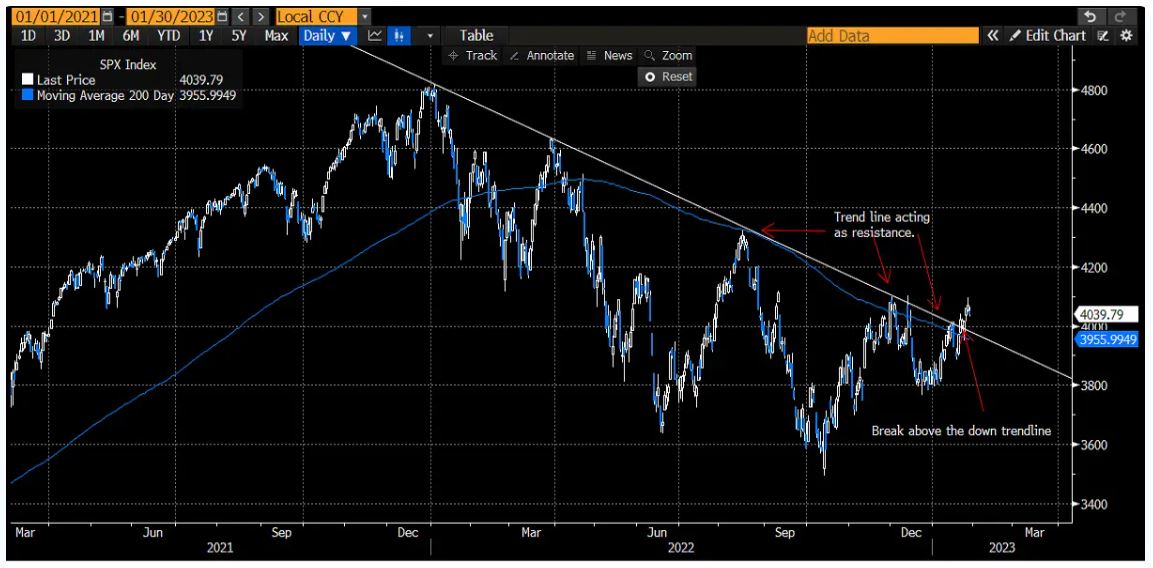
S&P 500 Index: 200-day moving average and trend line break. Source: Bloomberg.
Similarly, there’s been a positive technical break in the S&P 500 Index with a break above the downward trend, also in place since January 2022, and a close above the 200-day moving average (blue line).
So if the US does avoid a recession as Goldman predicts, and if Europe’s and China’s economies continue to chug along toward growth, the outlook for global stocks and commodities will have every reason to stay positive. And if all that happens and there’s a further decline in inflation, that’s the Goldilocks scenario, because it would force government bond yields lower too (further adding to the allure of risk assets). And in that case, you could consider investing in ARK Innovation ETF, the Invesco Nasdaq 100 ETF, or higher-beta growth stocks like Tesla and Amazon.
But remember, the markets are never fully without risk. And the potential for a recession is the biggest one right now. If the US economy shrinks radically and its unemployment rate shoots dramatically higher, there’d be significant downside for risk assets, and bond prices would rise as their yields decline. In this scenario, you’d want to consider a US government bond ETF, like the iShares 20+ Treasury Bond ETF.
Russell Burns is an analyst at finimize
ii and finimize are both part of abrdn.
finimize is a newsletter, app and community providing investing insights for individual investors.
abrdn is a global investment company that helps customers plan, save and invest for their future.
These articles are provided for information purposes only. Occasionally, an opinion about whether to buy or sell a specific investment may be provided by third parties. The content is not intended to be a personal recommendation to buy or sell any financial instrument or product, or to adopt any investment strategy as it is not provided based on an assessment of your investing knowledge and experience, your financial situation or your investment objectives. The value of your investments, and the income derived from them, may go down as well as up. You may not get back all the money that you invest. The investments referred to in this article may not be suitable for all investors, and if in doubt, an investor should seek advice from a qualified investment adviser.
Full performance can be found on the company or index summary page on the interactive investor website. Simply click on the company's or index name highlighted in the article.