Stockwatch: two shares that really catch my attention
Our companies analyst likes potential at this food supplier and a lower-risk share near a record high.
21st April 2020 13:53
by Edmond Jackson from interactive investor
Our companies analyst likes potential at this food supplier and a lower-risk share near a record high.

Two latest company releases epitomise the stockpickers’ dilemma. Do you take a leap into the dark with the vast majority of stocks where it is impossible to predict how long the businesses will be compromised, in what financial state they will emerge, and also their future trading environment?
The other choice is to back the lucky few that see no interruption, that have recovered all of March’s falls and may even enjoy a premium for scarcity. The Covid-19 environment - how soon we can emerge from lockdown and what risk of a second wave of infection - casts a blanket of fog over the usual landmarks for investment value.
Premier Foods finally turns around
I quite wondered if Premier Foods (LSE:PFD) ever would turn around, yet this £280 million food group looks to be crawling out of its liabilities-ridden mire and even enjoying demand for its processed foodstuffs.
The small cap stock has recovered its March drop from just over 40p to 18.5p as food is perceived as a safe haven, but also crucially in response to a strategically important update yesterday.
Agreement had been struck with pension trustees to reduce the net present value of contributions by around 45% from circa £310 million to £180 million, implying that by Premier’s year to March 2024, annual deficit contributions will reduce from £38 million to somewhere between £12 million and £25 million.
In the meantime, there are £4 million of annual savings on expenses. This is a significant weight off Premier’s mind, though not the only one.
The pension liabilities issue originates in the acquisition of RHM, whose pension fund means a net £1,070 million net surplus in plan assets (recorded on Premier’s September 2019 balance sheet as a non-current asset), albeit with a £3,793 million obligations deficit.
Alongside this is a £481 million assets’ deficit for the Premier scheme which also has a £1,275 obligations deficit. So, there’s a near-term deficit management issue despite a near £600 million overall pension assets’ surplus.
| Premier Foods - financial summary | ||||||
|---|---|---|---|---|---|---|
| year end 30 Mar | 2014 | 2015 | 2016 | 2017 | 2018 | 2019 |
| Turnover (£ million) | 856 | 964 | 772 | 790 | 819 | 824 |
| Operating margin (%) | 6.1 | -4.6 | 7.1 | 7.8 | 8.5 | 0.8 |
| Operating profit (£m) | 52.6 | -44.1 | 54.5 | 61.5 | 69.3 | 6.5 |
| Net profit (£m) | -246 | -124 | 29.2 | 5.5 | 7.2 | -33.8 |
| EPS - reported (p) | -12.8 | -12.7 | 4.1 | 0.7 | -4.0 | -2.5 |
| EPS - normalised (p) | -9.6 | -3.7 | 5.1 | 1.6 | 2.0 | 2.6 |
| Price/earnings ratio (x) | 15.8 | |||||
| Operating cashflow/share (p) | 23.9 | 0.5 | 11.5 | 4.4 | 6.2 | 6.9 |
| Capital expenditure/share (p) | 11.0 | 5.7 | 3.6 | 2.5 | 2.3 | 2.1 |
| Free cashflow/share (p) | 12.9 | -5.2 | 7.9 | 1.9 | 3.9 | 4.8 |
| Cash (£m) | 157 | 44.7 | 8.0 | 3.1 | 23.6 | 27.8 |
| Net debt (£m) | 831 | 585 | 534 | 523 | 496 | 470 |
| Net assets (£m) | 17.8 | 540 | 852 | 793 | 949 | 963 |
| Net assets per share (p) | 4.9 | 65.4 | 103 | 95.2 | 113 | 114 |
| Source: historic Company REFS and company accounts |
Mind that further liabilities still weigh
Last September there was £500 million long-term debt versus £29 million cash, and £248 million current trade payables versus £91 million current receivables. It was perturbing to see first-half cash generation in support of all this, only a modest £8 million and gobbled up by investing.
Monday’s update cites “in excess of £90 million cash generated from operations expected reported on the balance sheet as of end-March,” although it is being propped over £175 million with the help of £65 million extra debt from a revolving facility.
The interim statement showed net interest costs swiping 58% of operating profit i.e. a way to go with debt reduction.
This could indeed come down in due course however, given Premier has improved its marketing and now capitalising on higher demand. Trading for the latest financial year is cited at the top end of expectations – building on positive momentum through 2019, then a boost last March.
While sales have lately reduced from exceptional levels, they are at a higher level. The brands involved – Ambrosia, Batchelors, Bisto, Sharwoods, Homepride, Mr Kipling – are well-suited for meal-making at home and have longer shelf life, thus suiting shoppers during the pandemic.
Before this update, consensus was for normalised earnings per share (EPS) of 8.5p rising to 9p this year, hence a forward price/earnings (PE) multiple of 4.5 at a current share price of 41p to buy – the rating being low due to historic debt and pension liabilities which also compromise dividend restoration.
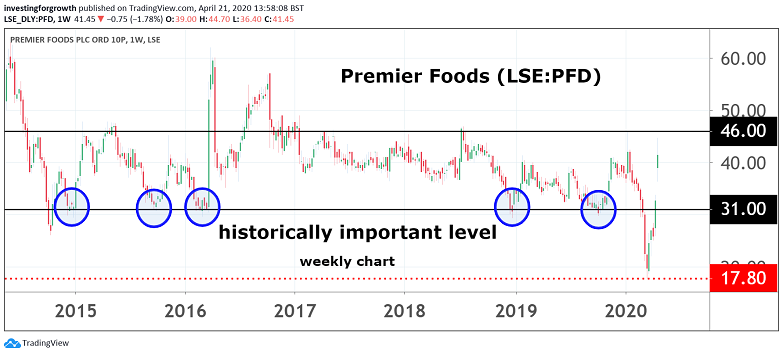
Source: TradingView Past performance is not a guide to future performance
It's still a better picture than in a long while
Investors will want to see improvement from the 2019 year’s crash in operating margin, although the table shows 7% to 8.5% as having been possible in previous years.
Going back further, Premier was also dumped from portfolios by those believing supplying highly competitive supermarkets was a mugs’ game in that they could dictate margin and get manufacturers to sponsor price offers – for the privilege of having shelf space.
With health advice favouring fresh over processed foods, could Premier even stand its ground with a basic operating margin let alone cut its liabilities pile?
That challenge hasn’t gone away, but the update is significant – for easing the burden and demonstrating sales progress that looks more established than in a long while.
For those appreciating higher risks behind a stock that could double to 80p in the medium term: Buy.
Telecoms prosperity is boosting demand for Cerillion software
It's the classic upshot of enhanced results for niche businesses serving bigger clients' needs. Cerillion (LSE:CER), a £72 million AIM-listed provider of billing and customer relationship management software to the telecoms market, has declared strong trading for its first half year to end-March, and “prospects for the remainder of the financial year continue to look very positive”.
At 245p, its stock has nearly regained January’s all-time high of 252p as the market gives respect for a 46% increase in like-for-like interim revenue to £10.2 million, if helped by a low arithmetic base.
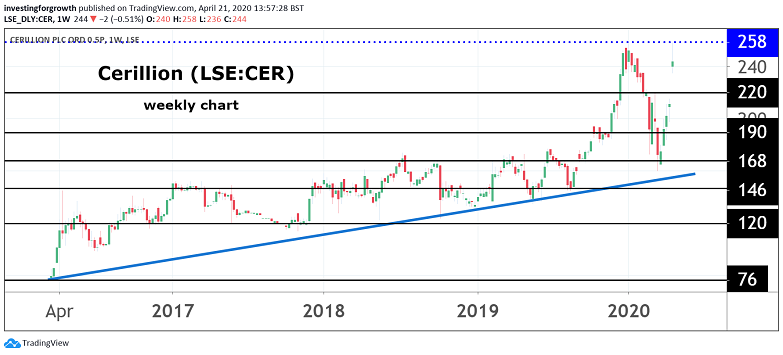
Source: TradingView Past performance is not a guide to future performance
End-March net cash of £4.8 million is up 85% and underwrites further investment in a context where the table already shows an impressive record of cash generation and free cashflow since 2017 – e.g. having released Cerillion 8.1 which “provides customers with significant operational efficiencies, customer engagement by mobile, and new channels for customer growth…”
Strong data traffic means Cerillion’s customers are seeing “strong data traffic levels arising from national lockdowns across the globe…a substantial resilience to our business model”.
It flags Cerillion as a rare momentum stock in the current environment “reflecting last year’s record level of major new orders, and we have recruited more staff to support ongoing growth.”
“Growth at fair price” despite the rebound
The stock justifiably rose 16% in response, and now trades on a classic growth rating around 20x forward earnings (taking a 12 months’ view).
That’s based on recent consensus for about £3.3 million net profit in the current financial year, for normalised EPS of 11.5p rising to 12.5p in 2021. Both numbers could potentially enjoy an upgrade, which could bring the price/earnings-to-growth (PEG) ratio back below 1.0, the classic benchmark for growth stock value. Admittedly, it’s small-scale as yet hence easier to show such metrics when the going is good.
A more questionable view would be, since Cerillion has been established 20 years providing said “mission critical” software, recently with some 90 customer installations across 40 companies, why is it not already showing sales that are a multiple of £19 million last year?
Its flotation has been relatively recent however, in early 2016, since when the underlying financials are growing particularly well – and the market is increasingly likely to latch onto this. I’m no expert on the competition, but this space looks attractive and reporting affirms it.
| Cerillion - financial summary | ||||||
|---|---|---|---|---|---|---|
| year end 30 Sep | 2014 | 2015 | 2016 | 2017 | 2018 | 2019 |
| Turnover (£ million) | 13.3 | 14.0 | 8.4 | 16.0 | 17.4 | 18.8 |
| Operating margin (%) | 19.7 | 15.3 | 5.2 | 13.1 | 10.9 | 13.4 |
| Operating profit (£m) | 2.6 | 2.1 | 0.4 | 2.1 | 1.9 | 2.5 |
| Net profit (£m) | 2.5 | 2.1 | 0.3 | 2.0 | 1.9 | 2.3 |
| EPS - reported (p) | 8.4 | 7.0 | 1.3 | 6.9 | 6.5 | 7.8 |
| EPS - normalised (p) | 8.4 | 7.0 | 3.4 | 6.9 | 6.8 | 7.8 |
| Price/earnings ratio (x) | 31.4 | |||||
| Operating cashflow/share (p) | 7.3 | 3.2 | -3.5 | 11.7 | 12.5 | 17.1 |
| Capital expenditure/share (p) | 1.6 | 3.3 | 3.2 | 3.6 | 5.6 | 4.1 |
| Free cashflow/share (p) | 5.7 | -0.1 | -6.7 | 8.1 | 6.9 | 13.0 |
| Dividends per share (p) | 3.9 | 4.2 | 4.5 | 4.9 | ||
| Yield (%) | 2.0 | |||||
| Covered by earnings (x) | 0.3 | 1.6 | 1.4 | 1.6 | ||
| Cash (£m) | 5.9 | 7.2 | 5.0 | 5.3 | 5.3 | 6.8 |
| Net debt (£m) | -5.9 | -7.2 | -0.4 | -1.7 | -2.5 | -5.0 |
| Net assets (£m) | 10.3 | 10.9 | 13.0 | 13.8 | 14.4 | 15.5 |
| Net assets per share (p) | 34.9 | 36.8 | 43.9 | 46.6 | 48.9 | 52.7 |
| Source: historic Company REFS and company accounts |
Insiders accumulating equity
On 25 February, the business development director bought £10,000 worth of shares at 213.5p and, after four directors/senior managers exercised options at 113.2p, they all opted to retain stock rather than cash in.
Altogether it is modest amounts but does support my sense that Cerillion rates attractively as a small cap tuck-away.
The end-September 2019 balance sheet had goodwill/intangibles comprising nearly half of £15.5 million net assets, albeit not unusual for a software business, and debt was just £1.8 million (mostly long-term) versus £6.8 million cash. So, it is a radical, cleaner contrast to Premier Foods’.
For investors who prefer a lower-risk tuck-away, I therefore suggest Cerillion instead, although both stocks catch my attention this week for favourable underlying dynamics. Buy.
Edmond Jackson is a freelance contributor and not a direct employee of interactive investor.
These articles are provided for information purposes only. Occasionally, an opinion about whether to buy or sell a specific investment may be provided by third parties. The content is not intended to be a personal recommendation to buy or sell any financial instrument or product, or to adopt any investment strategy as it is not provided based on an assessment of your investing knowledge and experience, your financial situation or your investment objectives. The value of your investments, and the income derived from them, may go down as well as up. You may not get back all the money that you invest. The investments referred to in this article may not be suitable for all investors, and if in doubt, an investor should seek advice from a qualified investment adviser.
Full performance can be found on the company or index summary page on the interactive investor website. Simply click on the company's or index name highlighted in the article.
Disclosure
We use a combination of fundamental and technical analysis in forming our view as to the valuation and prospects of an investment. Where relevant we have set out those particular matters we think are important in the above article, but further detail can be found here.
Please note that our article on this investment should not be considered to be a regular publication.
Details of all recommendations issued by ii during the previous 12-month period can be found here.
ii adheres to a strict code of conduct. Contributors may hold shares or have other interests in companies included in these portfolios, which could create a conflict of interests. Contributors intending to write about any financial instruments in which they have an interest are required to disclose such interest to ii and in the article itself. ii will at all times consider whether such interest impairs the objectivity of the recommendation.
In addition, individuals involved in the production of investment articles are subject to a personal account dealing restriction, which prevents them from placing a transaction in the specified instrument(s) for a period before and for five working days after such publication. This is to avoid personal interests conflicting with the interests of the recipients of those investment articles.