Analysis: Scotgold shares and the gold price
18th January 2022 07:34
by Alistair Strang from Trends and Targets
These shares are on a move upwards, but gold is stuck going sideways. Independent analyst Alistair Strang gives his view on the future price of both.
Scotgold (LSE:SGZ), our local gold miner here in Argyll, enjoys a share price which looks pretty capable of becoming interesting. Thankfully, this time around it appears movement should be on the strength of actions, rather than speculative discussion on the internet.
Again, thankfully, we’re able to suggest a pretty sane looking triggering event, one which is close to the current share price.
Our trigger appears quite tame, with a suggestion of movement next above 85p apparently being capable of price movement to an initial 91p. The key issue comes if 91p is exceeded, as we shall be inclined to view the price recovery as fuelled by proper strength, not chatroom generated optimism.
- Friends & Family: ii customers can give up to 5 people a free subscription to ii, for just £5 a month extra. Learn more
- Why reading charts can help you become a better investor
In the event the price exceeds 91p, further recovery toward 116p is anticipated, with a future 140p looking distinctly possible. Historically, we’ve been far from amused at the damage done to the share price, thanks to premature speculation.
If things intend go horribly wrong for Scotgold's share price, it needs to reverse below 58p, as this calculates with a reversal potential to an initial 48p with secondary, if broken, at a hopeful bottom of 33p.
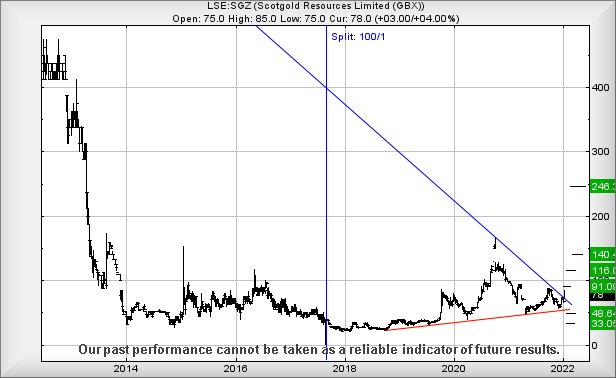
Source: Trends and Targets. Past performance is not a guide to future performance
As for gold, the yellow stuff has quite a strange story to tell!
The chart below shows a Blue trendline which the price of gold is cheerfully ignoring. The metal price broke upward last November, then retreated below the trend. It made another upward stab in December and a third attempt just last week. It’s noteworthy that each breakout attempt achieved a lower high than the previous, the first attempt hitting $1,877 followed by $1,830 in December and $1,828 last week.
If this were a share price, we’d now advocate extreme caution as a series of ‘Lower Highs’ can often prove to be a viable warning sign for imminent sharp reversals.
- Five AIM share tips for 2022
- Like AIM and small-company shares? Check out ii’s Super 60 recommended funds
- AIM: new floats aplenty in 2021, and more to come in 2022
- Watch our new year share tips here and subscribe to the ii YouTube channel for free
In the case of the price of gold, we’d now be quite concerned if the stuff melts below $1,782 as this could easily promote reversal to $1,726 initially with secondary, if (when) broken at a bottom of $1,676 and hopefully a proper bounce. The visuals tend to imply the potential for a bounce at such a level, if our worst fears come to fruition.
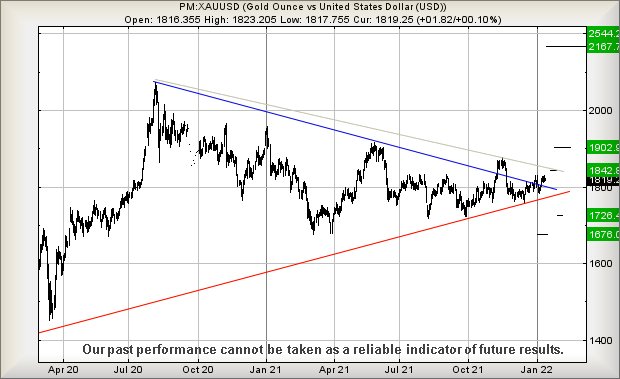
Source: Trends and Targets. Past performance is not a guide to future performance
However, if we pretend optimism, the stuff need only exceed $1,830 as this is supposed to trigger movement to $1,842. If bettered, there’s the potential of further oomph up to an eventual $1,902.
This target level is visually important, the big picture demanding the price actually close a session above $1,902 for the future to become truly fascinating. Closure above $1,902 has an amazing potential, apparently telling us the metal should commence a long-term cycle toward an eventual $2,544.
- Best 39 growth stocks for 2022
- Take control of your retirement planning with our award-winning, low-cost Self-Invested Personal Pension (SIPP)
In summary, if we were to rely on Big Picture numbers, we’re supposed to be relaxed as it’s easy to extrapolate an eventual $2,544. However, the repeat trend breaks and reversals over the last three months risk damaging confidence, creating a situation where things could go horribly wrong, very, very, fast.
Alistair Strang has led high-profile and "top secret" software projects since the late 1970s and won the original John Logie Baird Award for inventors and innovators. After the financial crash, he wanted to know "how it worked" with a view to mimicking existing trading formulas and predicting what was coming next. His results speak for themselves as he continually refines the methodology.
Alistair Strang is a freelance contributor and not a direct employee of Interactive Investor. All correspondence is with Alistair Strang, who for these purposes is deemed a third-party supplier. Buying, selling and investing in shares is not without risk. Market and company movement will affect your performance and you may get back less than you invest. Neither Alistair Strang or Interactive Investor will be responsible for any losses that may be incurred as a result of following a trading idea.
These articles are provided for information purposes only. Occasionally, an opinion about whether to buy or sell a specific investment may be provided by third parties. The content is not intended to be a personal recommendation to buy or sell any financial instrument or product, or to adopt any investment strategy as it is not provided based on an assessment of your investing knowledge and experience, your financial situation or your investment objectives. The value of your investments, and the income derived from them, may go down as well as up. You may not get back all the money that you invest. The investments referred to in this article may not be suitable for all investors, and if in doubt, an investor should seek advice from a qualified investment adviser.
Full performance can be found on the company or index summary page on the interactive investor website. Simply click on the company's or index name highlighted in the article.