Bezant Resources and its limbo dance share price
30th November 2021 07:44
by Alistair Strang from interactive investor
Independent analyst Alistair Strang looks at this sub-1p stock for signs of life. Is it worth further research?

A plaintive email, asking us to comment on this sub 1p share, proved a surprise. We previously reviewed copper/gold miner Bezant Resources (LSE:BZT) back in 2012, warning of extreme danger if the share price managed below 4.6p. This was a level below which we ran out of numbers. Two years later, the share price toddled off a cliff and we completely ignored it thereafter. What surprised us, in the years since, the share has remained trading.
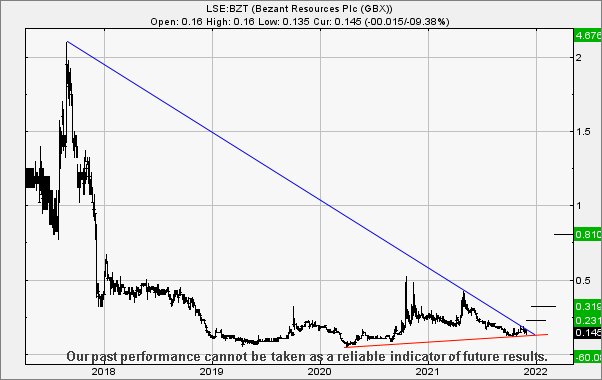
To be fair, we find viewing something which once sunk as low as 0.04p quite difficult to take seriously. Presently, the share is trading at 0.145p, so no matter what, anyone who bought at bottom must still be smiling.
However, our suspicion is this resilience over the years may indicate the market still attaches value to the share, perhaps with the potential of exhibiting some “proper” recovery. With the best will in the world, we cannot unearth any reason for a return to 80p, the price level at the start of 2012.
- Friends & Family: ii customers can give up to 5 people a free subscription to ii, for just £5 a month extra. Learn more
- Why reading charts can help you become a better investor
Instead, the safest thing to remember is crucial, every single reversal calculation we throw at the price returns a result prefaced with a minus sign. From our perspective, the only thing positive we dare take away from Bezant is the fact they have remained trading, despite their share price getting a bigger hammering than a Boris Johnston speech.
The company website also appears fairly informative but we again stress, we can only view this 0.14p as a “punt”. Maybe it shall actually do something positive eventually and maybe the market shall not play games with the buy/sell spread.

Source: Trends and Targets. Past performance is not a guide to future performance
When we search for trigger levels, it appears the share price currently needs to exceed 0.19p to potentially trigger a gain to a stunning 0.23p. If exceeded, our secondary calculates at 0.31p.
For the longer term, something quite extraordinary occurs, if the share discovers an excuse to close a session above 0.31p. We will be forced to regard 0.81p as exerting an influence, representing a point at which we shall need stir the tea leaves again to refresh the future potentials.
Who knows, perhaps this one shall prove worth some research.
Alistair Strang has led high-profile and "top secret" software projects since the late 1970s and won the original John Logie Baird Award for inventors and innovators. After the financial crash, he wanted to know "how it worked" with a view to mimicking existing trading formulas and predicting what was coming next. His results speak for themselves as he continually refines the methodology.
Alistair Strang is a freelance contributor and not a direct employee of Interactive Investor. All correspondence is with Alistair Strang, who for these purposes is deemed a third-party supplier. Buying, selling and investing in shares is not without risk. Market and company movement will affect your performance and you may get back less than you invest. Neither Alistair Strang or Interactive Investor will be responsible for any losses that may be incurred as a result of following a trading idea.
These articles are provided for information purposes only. Occasionally, an opinion about whether to buy or sell a specific investment may be provided by third parties. The content is not intended to be a personal recommendation to buy or sell any financial instrument or product, or to adopt any investment strategy as it is not provided based on an assessment of your investing knowledge and experience, your financial situation or your investment objectives. The value of your investments, and the income derived from them, may go down as well as up. You may not get back all the money that you invest. The investments referred to in this article may not be suitable for all investors, and if in doubt, an investor should seek advice from a qualified investment adviser.
Full performance can be found on the company or index summary page on the interactive investor website. Simply click on the company's or index name highlighted in the article.