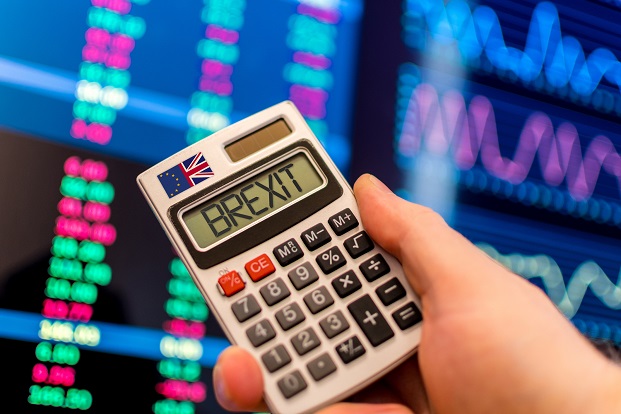
Brexit two years on
26th January 2022 12:29
by Jemma Jackson from interactive investor
If the major global stock markets were in a football league table, the FTSE 100 would be hovering just above relegation zone, says interactive investor.
- interactive investor looks at index and stock performance since Brexit day 2020.
- With supply chain blockages hopefully clearing, and UK dividends looking more positive,could 2022 be the UK’s year?
Proving that small can be beautiful, by comparison the FTSE 100 and FTSE All-Share are up just 2.87% and 3.71% respectively. The S&P 500, meanwhile, is up 35% over the two years, although pride can come before a fall, as more recent volatile performance demonstrates after the tech sell-off. The ongoing UK uncertainty from the coronavirus pandemic over the same time period makes it difficult to measure the exact impact of Brexit alone on UK markets and fund performance. And that’s even before recent geo-political tensions around Russia and Ukraine thrown into the mix more, let alone inflationary pressures. But we can certainly see some clear trends.
The UK market is often well represented by banks, oil and gas producers, miners, and tobacco manufacturers. Less so by large technology companies. This makes the UK’s FTSE indexes a good barometer of the UK’s performance, although even overseas earnings complicate matters.
Of course, the impact of Brexit is likely to have put off many overseas investors into the UK over the last two years, which is perhaps another reason why the UK has been out of favour for so long. But is this still warranted?
The relegation zone
Lee Wild, Head of Equity Strategy, interactive investor, says: “The Brexit years have not been kind to the UK’s largest listed companies. The blue-chip index is up less than 3% compared with 48% for the US Nasdaq tech market and around 20% for European peers in France and Germany. If the major global stock markets were in a football league table, the FTSE 100 would be hovering just above the relegation zone. Only Brazil, Hong Kong and Russia have done worse in the past two years. It’s even underperformed UK mid-caps which were thought to be more vulnerable to a Brexit shock, and seriously lags the index of nimble AIM stocks which are also stuck in the bottom half of the table.
“Britain’s blushes were only saved by a rally in the final quarter of 2021, dragging the FTSE 100 above pre-Covid levels. Its underperformance has had little to do with Brexit and more to do with its composition, which was made all too clear during the pandemic. Key sectors like banks, travel companies and housebuilders have all done terribly, held back by Covid restrictions, supply chains problems, and record low interest rates.
“But markets are cyclical, and UK stocks look cheap compared to those overseas. Interest rates are heading higher, supply chain blockages will clear and millions of us will be able to fly abroad this summer. Companies with solid fundamentals like revenue, profits and dividends should do well. Could 2022 be our year?”
Richard Hunter, Head of Markets, interactive investor, adds: “The increase in the oil price, and the tightening of monetary conditions generally, have both underlined the FTSE100’s increasing emergence as something of a defensive play for investors.
“Both oil and bank sectors are adequately represented within the index and, allied to a raft of mature companies with varying degrees of pricing power, there is an element of inflation-proofing built in. At the same time, the valuation of the index remains undemanding compared to global peers, while the average dividend yield is also high compared to other key markets.
“The UK has certainly not escaped the pressures currently being experienced on a global scale, but it has been rather less susceptible to the volatility which has dominated market sentiment so far, partly due, perhaps, to its limited exposure to the likes of big tech. Following a decent open driven by a broad mark-up of oil and travel-related stocks, the UK’s premier index remains marginally ahead, having added 0.8% in the year to date.”
A long-awaited recovery for UK dividends?
By looking at the outlook for UK dividends – perhaps investors have more reasons to be positive on the UK.
Keith Bowman, Investment Analyst, interactive investor, explains: “UK dividends since the UK’s exit from the EU in January 2020 have been very much dominated by the global pandemic. Two thirds of companies cancelled or cut their dividends between the second quarter and the fourth quarter during the first year of the UK’s exit from the European Union given the need to conserve cash under population lockdowns, operational disruption, and significant outlook uncertainty.
“However, vaccines and adapted working practices provided for a recovery in confidence in the second year of the UK’s EU exit. Ordinary dividend payouts rose by around a fifth year-over-year.”
So, are investors missing a trick?
The UK market has a reputation for being home to the older, incumbent players, and not the newer and generally more popular technology companies. However, this does not mean there are not plenty of opportunities for investors to make significant gains. This is especially relevant within the context of the recent market sell-off. But as well as stocks - funds and investment trusts can also provide investors with an alternative way of getting exposure to the UK markets.
Kyle Caldwell, Collectives Specialist, interactive investor, says: “Over the past couple of years, investors have turned their backs on UK funds, owing to Brexit uncertainty followed by the Covid-19 pandemic. This has proved to be the correct call. When looking at 21 Investment Association sectors that invest in shares, UK Equity Income and UK All Companies are two of the four worst performers since Brexit day, 31 January 2020.”
“The average UK Equity Income fund has returned 9.6%, putting it second from last. The only sector that has performed worse is Latin America, with the average fund down 19.6%. The average UK All Companies fund is up 11%. Also in the bottom four, with a return of 10%, is Japanese Smaller Companies. The UK Smaller Companies sector, however, has bucked the trend. The average fund has returned 25%, putting it in eighth place out of the 21.
“When examining the performance of those 21 sectors over the past year – from 31 January 2021 – the tide has turned. UK Equity Income, UK Smaller Companies and UK All Companies are three of the four top performing sectors, with returns of 20.4%, 17.2% and 16.2%. The only sector that has performed better is India/Indian Subcontinent, with an average return of 29.3%.”
Kyle Caldwell, Collectives Specialist, interactive investor, adds: “Investors, however, have continued to give UK funds the cold shoulder, so have potentially missed a trick. Over the past year, there have only been three months that have seen UK equity funds post inflows across those three sectors. One driver behind the UK’s performance turnaround has been the return to form of value shares, which tend to be more economically sensitive. Value sectors – oil, gas, miners and banks – comprise a large part of the FTSE 100’s market cap.
“It is early days, but at the start of 2022, the rotation into value shares has been gathering pace, which has been negatively impacting technology shares. While this could be a supportive backdrop for the UK market, it makes sense not to bet one way or the other. Instead, it is more prudent to invest in both styles as part of a diversified portfolio. A potential pairing is Temple Bar (LSE:TMPL), which invests in UK value shares.”
Dzmitry Lipski, Head of Funds Research, interactive investor, adds: “the LF Lindsell Train UK Equity is managed by a very experienced manager, Nick Train, with an excellent track record. The manager's investment horizon is long term and relies on building a high-conviction portfolio of quality growth stocks and is unconstrained by its benchmark and sector. As such, the portfolio may look very different from the FTSE All-Share index, and performance is likely to substantially deviate from its benchmark.
“Train looks for durable, cash-generative businesses that will still be profitable in 20 years’ time, maintain a high return on capital, and demonstrate superior capital allocation. He finds most of these companies in the food and beverage, internet/media/software, financials, and healthcare industries. Train finds that companies with brands or franchises of great durability and value, are not only rare, but also appear to be undervalued by other investors for most of the time. So, by forming a high conviction, concentrated portfolio, they should better reduce risk over the longer term, rather than via diversification.”
“Another example is theJupiter UK Special Situations has been managed by Ben Whitmore since November 2006. Despite strong long-term performance, the fund’s value bias and contrarian approach do mean that returns can deviate significantly from those of the index from time-to-time. The investment approach reflects the fund managers contrarian and value-orientated investment philosophy. They aim to identify longer-term valuation anomalies by looking for stocks that have an attractive price-to-earnings ratio when calculated using 10-year average earnings, but are nevertheless well-run companies with sound balance sheets.
“Qualifying stocks are then subject to fundamental analysis before being added to the portfolio, which is unconstrained relative to the FTSE All-Share benchmark. The managers recognise that realising value can often take a long time, so the average holding period for a stock is often high, with fund turnover consequently low.”
Past performance is no guide to the future and the value of investments (and the income from it) can go down as well as up and you may not get back the full amount invested.
Index performance is ii using SharePad in the two years since 31 January 2020 to 26 January 2022.
Fund sector performance is ii using FE Analytics from 31 Jan 2020 to 24 Jan 2022.
These articles are provided for information purposes only. Occasionally, an opinion about whether to buy or sell a specific investment may be provided by third parties. The content is not intended to be a personal recommendation to buy or sell any financial instrument or product, or to adopt any investment strategy as it is not provided based on an assessment of your investing knowledge and experience, your financial situation or your investment objectives. The value of your investments, and the income derived from them, may go down as well as up. You may not get back all the money that you invest. The investments referred to in this article may not be suitable for all investors, and if in doubt, an investor should seek advice from a qualified investment adviser.
Full performance can be found on the company or index summary page on the interactive investor website. Simply click on the company's or index name highlighted in the article.