Chart of the week: are IAG shares about to take off?
8th November 2021 12:45
by John Burford from interactive investor
The owner of British Airways has had a rough ride during the pandemic, but our charts expert thinks downside risk is lower than the upside potential.

International Consolidated Airlines Group (LSE:IAG) is best known in the UK as the owner of British Airways, but the group also holds Iberia, Aer Lingus, Vueling and LEVEL with IAG Cargo. So, it has been in the direct firing line of the restrictions on air travel from the global pandemic.
With the severe loss of income in recent months, the shares have plummeted from 615p at the start of the pandemic to the September 2020 low of just 80p – a loss of 87%.
And since that low, the shares have been creeping up fitfully to the recent 180p. Investors who took the plunge near the lows have seen the share price improve by 100% - but is there more to come?
This year, it is estimated that there will be 2.2 billion global air passengers, which is a 50% reduction from the pre-pandemic 2019 figure. The greatest fall-off was in 2020 when 1.8 billion air passengers flew (a 60% reduction from 2019). Because airlines have massive overhead costs, this relatively moderate loss of passengers translated into big operating losses for the airlines.
Looking ahead, if passengers do recover well into 2022, the airlines should operate very profitably – and the shares should respond strongly to the upside.
Much is riding on the coming winter and the spectre of renewed travel restrictions if Covid rears its head once more. But with the US finally opening its borders to international visitors, the momentum is with greater travel and bullish implications for the industry.
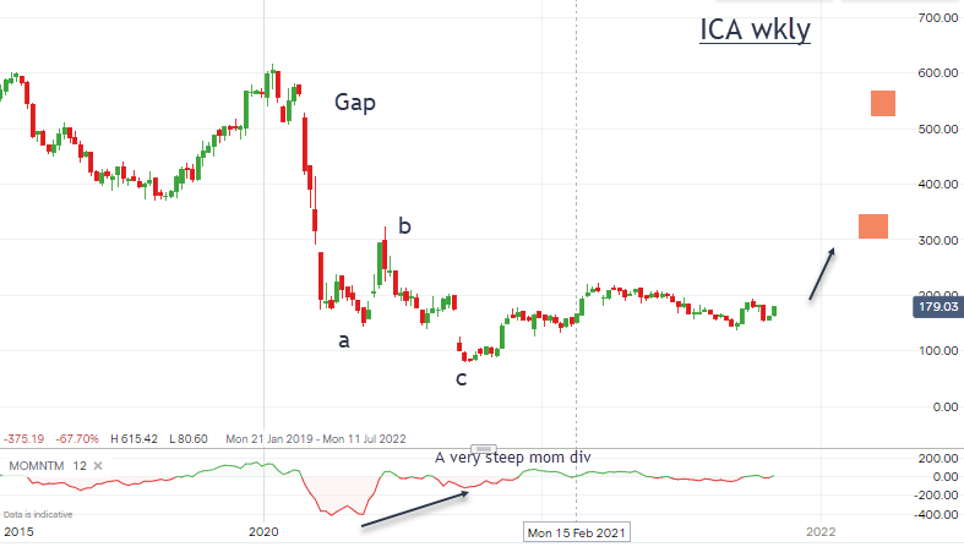
The charts show the potential – here is the set-up on the weekly:
Past performance is not a guide to future performance
From the January 2020 615p high, the Corona Crash brought the shares down with a bump and, in a familiar and characteristic a-b-c three down pattern, to the September 80p low.
The crucial point is that the third 'c' wave landed with a massive momentum divergence compared with momentum at the higher 'a' wave low. This is a sure sign that savvy investors were seeing past the pandemic to blue skies beyond and getting shares into their stronger hands.
The moves up have been steady rather than spectacular so far, but is that about to change? The message of the momentum divergence signal has not yet been fully realised and thus the potential for a more rapid ascent remains on the table.
In the background (or is that foreground?) is the war on kerosene (jet fuel) that may restrict air travel growth until another power source is developed at scale.
That is likely to be some way off, if it ever is actually realised. There is much talk about imposing air travel with much higher 'carbon' taxes, which would be a blow to the cheap fares policies now in place on the budget carriers.
In any case, I believe the downside risk is lower than the upside potential and the shares should continue their upward trajectory. My first target is in the 320p region.
John Burford is the author of the definitive text on his trading method, Tramline Trading. He is also a freelance contributor and not a direct employee of interactive investor.
These articles are provided for information purposes only. Occasionally, an opinion about whether to buy or sell a specific investment may be provided by third parties. The content is not intended to be a personal recommendation to buy or sell any financial instrument or product, or to adopt any investment strategy as it is not provided based on an assessment of your investing knowledge and experience, your financial situation or your investment objectives. The value of your investments, and the income derived from them, may go down as well as up. You may not get back all the money that you invest. The investments referred to in this article may not be suitable for all investors, and if in doubt, an investor should seek advice from a qualified investment adviser.
Full performance can be found on the company or index summary page on the interactive investor website. Simply click on the company's or index name highlighted in the article.
Disclosure
We use a combination of fundamental and technical analysis in forming our view as to the valuation and prospects of an investment. Where relevant we have set out those particular matters we think are important in the above article, but further detail can be found here.
Please note that our article on this investment should not be considered to be a regular publication.
Details of all recommendations issued by ii during the previous 12-month period can be found here.
ii adheres to a strict code of conduct. Contributors may hold shares or have other interests in companies included in these portfolios, which could create a conflict of interests. Contributors intending to write about any financial instruments in which they have an interest are required to disclose such interest to ii and in the article itself. ii will at all times consider whether such interest impairs the objectivity of the recommendation.
In addition, individuals involved in the production of investment articles are subject to a personal account dealing restriction, which prevents them from placing a transaction in the specified instrument(s) for a period before and for five working days after such publication. This is to avoid personal interests conflicting with the interests of the recipients of those investment articles.