Chart of the week: are oil majors winning over sceptics?
Our chartist remains bullish on oil monsters – and minnows.
8th March 2021 12:04
by John Burford from interactive investor
Our chartist remains bullish on oil monsters – and minnows.

My recent coverage of the UK oil majors started in my 19 October column last year.
At that time, the market was supremely bearish on oil and oil shares. It (erroneously) believed that the oil market was hugely over-supplied, while the memory of the futures price going negative in April was still fresh in traders’minds.
As I pointed out in October, the oil price was recovering from that low point but oil shares were not. I believed there was a huge opportunity for the market to wake up to reality and set oil shares upwards.
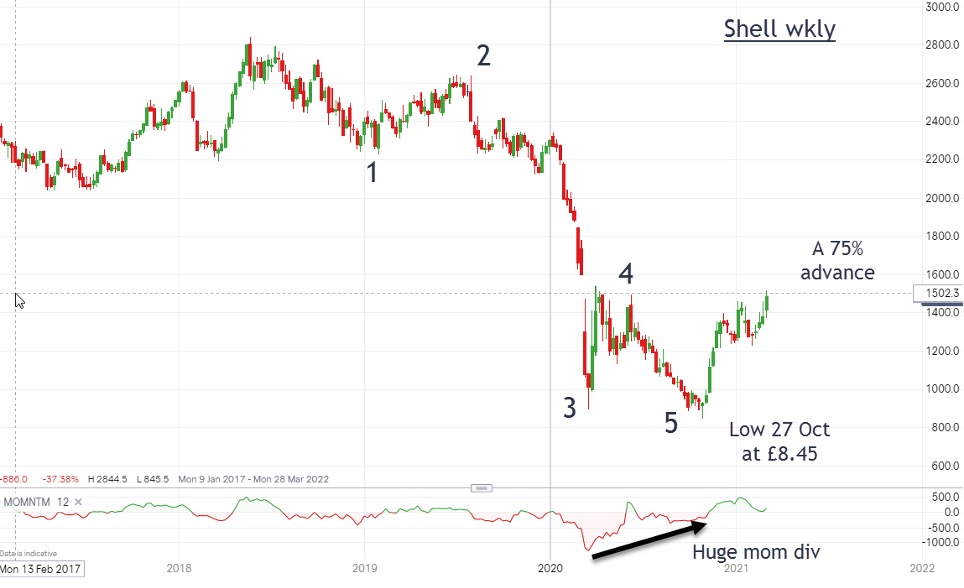
My timing was fortuitous, as both BP (LSE:BP.) and Shell (LSE:RDSB) made their major lows just a week later on 27 October – plenty of time to take action!
But of course, if we believed the simplistic story that oil was in decline and renewables on the rise, you might take the view of the vast majority that oil shares were to be avoided at all costs, especially if you wanted to ‘save the planet’. And that would have been a missed opportunity.
- The big dividends on offer from Big Oil
- Shell calls ‘peak oil’ as it sets out net-zero emissions plan
In fact, in the 18 weeks since the lows, the majors have advanced by a stunning 70% - and the minnows by a tasty 260%.
This is the updated chart that guided me with this:
Past performance is not a guide to future performance.
In the autumn, I was searching for the low in wave five, knowing that when it terminated the snap-back would very likely be fierce given the very strong momentum divergence.
Remember, these indicate a rapid weakening of selling pressure that leads to the triumph of the buyers. In fact, as the market moved up from that low it was the strongest gain since that final flourish of the bull in April 2018.
In the meantime, the oil price advance has been defying the many sceptics, while US crude is now pushing the $66 (£47.68) point – a level barely conceivable a few months ago.
I believe it could reach my target of $76 and possibly $92 on this leg. And, if Russia and OPEC play their cards right, I see a possible test of $112. Where would the oil majors be in this scenario?
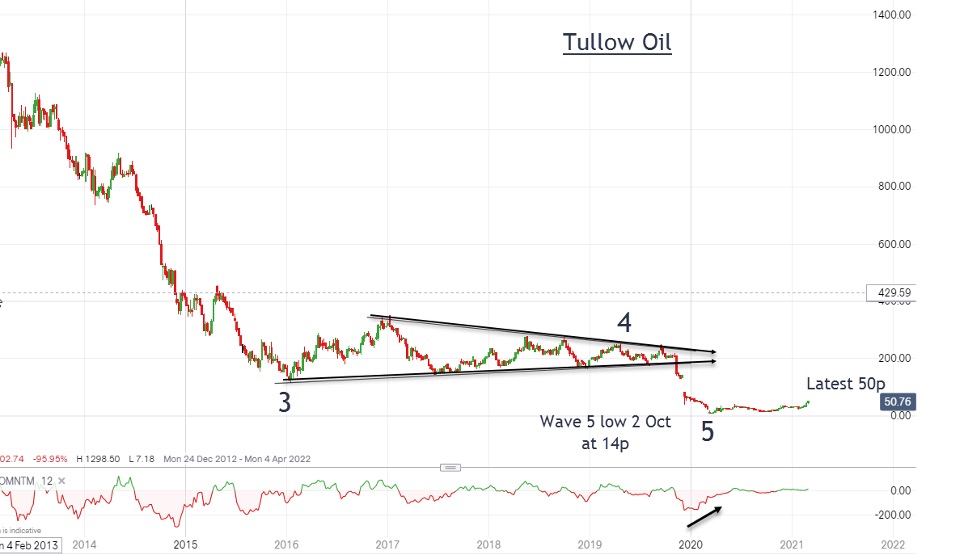
Of course, such a beat-up minnow as Tullow Oil (LSE:TLW) has advanced even more on a percentage basis. From its low on 2 October at 14p, it has pushed up to the 50p mark – a gain of 260%. Not too shabby for a once written-off share.
Past performance is not a guide to future performance.
Of course, Tullow is more vulnerable to the oil price than the majors but if any of my targets work out, these shares could hit the 150p – 200p zone.
I remain bullish on oil shares!
John Burford is the author of the definitive text on his trading method, Tramline Trading. He is also a freelance contributor and not a direct employee of interactive investor.
These articles are provided for information purposes only. Occasionally, an opinion about whether to buy or sell a specific investment may be provided by third parties. The content is not intended to be a personal recommendation to buy or sell any financial instrument or product, or to adopt any investment strategy as it is not provided based on an assessment of your investing knowledge and experience, your financial situation or your investment objectives. The value of your investments, and the income derived from them, may go down as well as up. You may not get back all the money that you invest. The investments referred to in this article may not be suitable for all investors, and if in doubt, an investor should seek advice from a qualified investment adviser.
Full performance can be found on the company or index summary page on the interactive investor website. Simply click on the company's or index name highlighted in the article.
Disclosure
We use a combination of fundamental and technical analysis in forming our view as to the valuation and prospects of an investment. Where relevant we have set out those particular matters we think are important in the above article, but further detail can be found here.
Please note that our article on this investment should not be considered to be a regular publication.
Details of all recommendations issued by ii during the previous 12-month period can be found here.
ii adheres to a strict code of conduct. Contributors may hold shares or have other interests in companies included in these portfolios, which could create a conflict of interests. Contributors intending to write about any financial instruments in which they have an interest are required to disclose such interest to ii and in the article itself. ii will at all times consider whether such interest impairs the objectivity of the recommendation.
In addition, individuals involved in the production of investment articles are subject to a personal account dealing restriction, which prevents them from placing a transaction in the specified instrument(s) for a period before and for five working days after such publication. This is to avoid personal interests conflicting with the interests of the recipients of those investment articles.