Chart of the week: is the biggest gold miner about to rally?
25th July 2022 13:37
by John Burford from interactive investor
A slump in the gold price has taken the world's largest gold mining company down with it. But technical analyst John Burford thinks the tide is about to turn. Here’s why.

Gold miners are out of favour - buy
One of the most contrarian plays today must surely be the gold miners, which are trading near two-year lows. And no wonder – the gold price has crashed from $2,075 (£1,600) an ounce in March to last week's $1,681 low – a loss of 19% in only four and a half months.
This slide in gold has occurred while the US dollar advanced by about the same degree in that time. While not always holding true, in recent months the dollar and gold have been highly correlated. If this continues, and if the almighty dollar does start to fall off its perch - as I have reason to believe it will – then the gold price should react positively over the next few weeks and months.
- Watch our mining special video: shares to own in the second half of 2022
- Start of a massive rally phase for Glencore shares?
Here is the latest gold action on the daily chart:
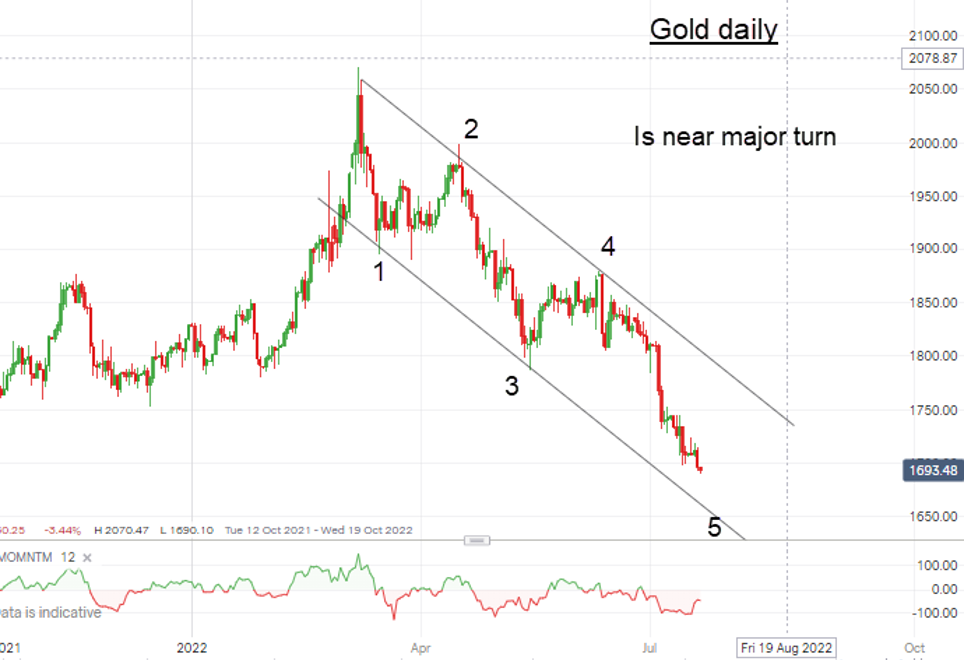
Past performance is not a guide to future performance.
There is a very clear five-wave impulsive pattern to the decline, with the current fifth wave very late in development. And the decline has been travelling along my tramlines, with the fifth wave not yet meeting the lower line (support). This miss may be highly significant since a low put in here would imply the buying forces are starting to overpower the selling by some margin.
The largest and one of the oldest gold miners is Newmont Corp (NYSE:NEM), and here is its chart:
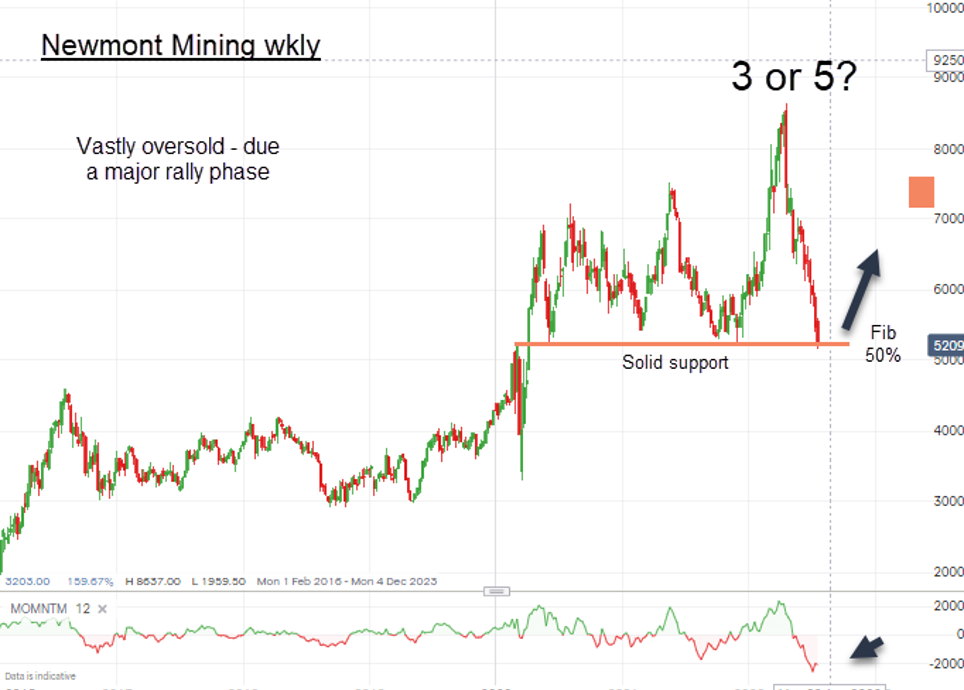
Past performance is not a guide to future performance.
The shares hit a high at $86 with the gold price in April and crashed to last week's low of $51 – a decline of 40%. This is about double the 19% drop in the gold price, which illustrates how mining shares are geared to the gold price (miners have fixed costs). I expect this gearing to apply when the gold price appreciates.
A couple of things stand out on the chart. First, the shares have dropped right into my pink support zone that marks the Fibonacci 50% correction of the entire bull run off the major bear market low at $15 in 2015.
Also, the recent decline has been so sharp that it has produced a record low momentum reading. This indicates almost panic-selling by the bulls who had put their faith in a financial calamity earlier this year (that has not materialised).
- 12 stocks for dividend investors hunting for high yields
- Read more of our articles on technical analysis here
While stock markets did move sharply lower earlier this year – egged on by the growing hawkish Fed commentary – the failure of the gold price to respond to the surge in consumer price inflation must have been a shock to the bulls.
After all, we know that gold is supposed to move higher with inflation, isn't it? Sorry, that's another myth busted!
Today, the gold bugs are silent and gold has disappeared from the financial headlines. It seems no one is following it. And that is a perfect backdrop for savvy investors to start to take note.
We could see a little more downside near term if the dollar has a little more puff left, but I believe major lows are close. If the shares drop to the $45 region, I would head for the drawing board and re-assess. But in the medium term, I believe gold and the miners will re-take their places in the sun.
John Burford is a freelance contributor and not a direct employee of interactive investor.
These articles are provided for information purposes only. Occasionally, an opinion about whether to buy or sell a specific investment may be provided by third parties. The content is not intended to be a personal recommendation to buy or sell any financial instrument or product, or to adopt any investment strategy as it is not provided based on an assessment of your investing knowledge and experience, your financial situation or your investment objectives. The value of your investments, and the income derived from them, may go down as well as up. You may not get back all the money that you invest. The investments referred to in this article may not be suitable for all investors, and if in doubt, an investor should seek advice from a qualified investment adviser.
Full performance can be found on the company or index summary page on the interactive investor website. Simply click on the company's or index name highlighted in the article.
Disclosure
We use a combination of fundamental and technical analysis in forming our view as to the valuation and prospects of an investment. Where relevant we have set out those particular matters we think are important in the above article, but further detail can be found here.
Please note that our article on this investment should not be considered to be a regular publication.
Details of all recommendations issued by ii during the previous 12-month period can be found here.
ii adheres to a strict code of conduct. Contributors may hold shares or have other interests in companies included in these portfolios, which could create a conflict of interests. Contributors intending to write about any financial instruments in which they have an interest are required to disclose such interest to ii and in the article itself. ii will at all times consider whether such interest impairs the objectivity of the recommendation.
In addition, individuals involved in the production of investment articles are subject to a personal account dealing restriction, which prevents them from placing a transaction in the specified instrument(s) for a period before and for five working days after such publication. This is to avoid personal interests conflicting with the interests of the recipients of those investment articles.