Chart of the week: is bombed-out BT finally a massive buy?
After years in decline, last week might be a selling climax and the prelude to a solid rally phase.
11th May 2020 10:54
by John Burford from interactive investor
After a number of years in decline, our chartist examines whether last week’s share price plunge might be a selling climax and the prelude to a solid rally phase.

Last week, long-suffering BT (LSE:BT.A) shareholders felt the indignity of the first dividend suspension since 1984, as well as the formation of a strong rival in the O2/Virgin Media merger. A double whammy indeed.
With no payout this year and an uncertain one next, the shares now become a pure capital gains play, rather than a reliable but boring dividend payer so beloved by pension funds.
Will many of the latter now give up and cash out, or will many take a long-term view and hang on? To be frank, there are few good dividend payers out there any more since a whole host of companies are cutting and/or eliminating dividends as the pandemic takes its toll. We are now in a new era of reduced income expectations. And, of course, that is firmly deflationary.
But ‘bad’ news is nothing new to this old warhorse of the LSE. In fact, the shares have been on a steady slide since the heady days of 1999, when at the height of the tech boom the shares reached the giddy heights above £10.
- BT shares: should investors still own them after dividend scrapped?
- A checklist for finding dividend shares in a crisis
- Take control of your retirement planning with our award-winning, low-cost Self-Invested Personal Pension (SIPP)
There was a mini boom in the 2010s when the shares reached a Fibonacci 50% retrace of the old all-time high at £5. But, since 2015, they have been in a solid bear trend to reach Friday’s low at the £1 region.
So, with the ‘bad’ news out of the way and sentiment at rock bottom as dividend-seeking investors shun the shares, are we at a major low? After all, shares make major lows when bullish sentiment is weak, not otherwise. Let’s take a look.
This is the long-term monthly chart:
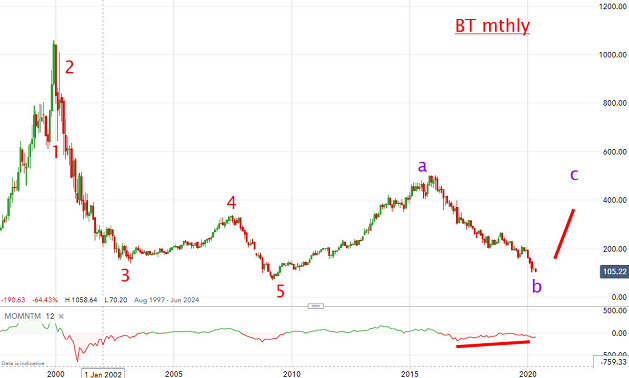
Source: interactive investor. Past performance is not a guide to future performance.
We are at the wave ‘b’ low at around £1 which is a decade-old low. Note the momentum divergence here – a sign that the selling pressure is gradually drying up on this scale.
If the shares can base around here, we will see the market begin a rally phase in a ‘c’ wave that should last many months, if not years.
Here is a close-up on the daily chart:
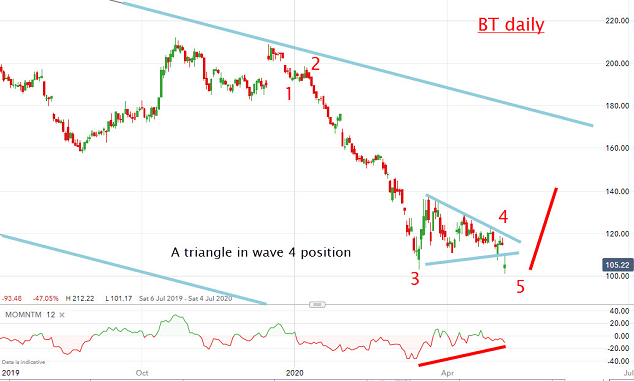
Source: interactive investor. Past performance is not a guide to future performance.
The important feature here is the textbook triangle/wedge in the fourth wave position. And on Friday, the market broke below this wedge in a final fifth wave thrust. When this wave terminates, it is highly likely we will see a swift reversal up, especially given the very strong momentum divergence.
So, I am expecting this thrust up to confirm last week as a selling climax and the prelude to a solid rally phase.
Provided this scenario pans out, my first major target is the £1.60 area. I believe downside risk is low at this £1 region.
I own BT shares.
For more information about Tramline Traders, or to take a three-week free trial, go to www.tramlinetraders.com.
John Burford is the author of the definitive text on his trading method, Tramline Trading. He is also a freelance contributor and not a direct employee of interactive investor.
These articles are provided for information purposes only. Occasionally, an opinion about whether to buy or sell a specific investment may be provided by third parties. The content is not intended to be a personal recommendation to buy or sell any financial instrument or product, or to adopt any investment strategy as it is not provided based on an assessment of your investing knowledge and experience, your financial situation or your investment objectives. The value of your investments, and the income derived from them, may go down as well as up. You may not get back all the money that you invest. The investments referred to in this article may not be suitable for all investors, and if in doubt, an investor should seek advice from a qualified investment adviser.
Full performance can be found on the company or index summary page on the interactive investor website. Simply click on the company's or index name highlighted in the article.
Disclosure
We use a combination of fundamental and technical analysis in forming our view as to the valuation and prospects of an investment. Where relevant we have set out those particular matters we think are important in the above article, but further detail can be found here.
Please note that our article on this investment should not be considered to be a regular publication.
Details of all recommendations issued by ii during the previous 12-month period can be found here.
ii adheres to a strict code of conduct. Contributors may hold shares or have other interests in companies included in these portfolios, which could create a conflict of interests. Contributors intending to write about any financial instruments in which they have an interest are required to disclose such interest to ii and in the article itself. ii will at all times consider whether such interest impairs the objectivity of the recommendation.
In addition, individuals involved in the production of investment articles are subject to a personal account dealing restriction, which prevents them from placing a transaction in the specified instrument(s) for a period before and for five working days after such publication. This is to avoid personal interests conflicting with the interests of the recipients of those investment articles.