Chart of the week: can rising bond yields help Lloyds?
Lloyds has been exempt from recent market rallies, but our technical analyst thinks that could change.
17th August 2020 12:27
by John Burford from interactive investor
The high street bank has been exempt from recent market rallies, but our technical analyst John Burford thinks that is about to change.

I last covered Lloyds (LSE:LLOY) in my column on March, 9 as markets were in free-fall at the height of the coronavirus crash. The FTSE low was set a few days later on 23 March, when Lloyds traded around the bombed-out 30p area.
Since then, the FTSE 100 has improved up by a healthy 1,200 pts (25%) - but has Lloyds matched it?
In fact, it has gone nowhere. It trades still in the 30p range. It has not taken part in the strong market rallies of recent weeks.
It is not hard to see why. Bullish sentiment is on the floor as the economy remains pandemic-depressed, while loan margins are still wafer-thin.
But could this relative under-performance be about to change? I have been expecting an increase in bond yields for a while now. Last week my confidence in that outlook improved with US Treasury prices falling after a ‘surprise’ poor US government auction.
- Chart of the week: The outlook for Lloyds Banking Group shares
- Richard Buxton interview: Lloyds Bank's results and dividend optimism
- Outlook for Lloyds Banking Group shares in 2020
Virtually no one expects interest rates and yield to do anything other than move ‘lower for longer,’ with some expecting even more rates to go negative. I am taking the other side of that bet.
So is indigestion setting in to the US Treasury market? With a veritable tsunami of supply to be issued to finance the various bail-outs, any demand hiccough would send shockwaves through the global financial markets.
So this may well be the ultimate test of the fashionable MMT (Modern Money Theory), which claims debt does not matter and sovereigns can rack up their debt to infinity – and beyond - with no consequence to financial markets. We shall see.
But a rising bond yield would do wonders to banks’ earnings – and send depressed equities northwards at a rate of knots.
And my technical studies certainly point to this bullish outlook:
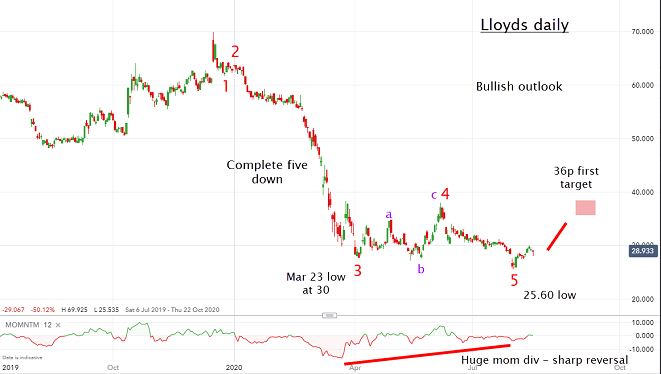
Source: interactive investor. Past performance is not a guide to future performance.
I have a textbook five down off the December 70p high complete with a massive momentum divergence. Remember, a momentum divergence in the fifth wave position usually indicates a trend reversal. And the sharper the divergence, the harder and faster the likely reversal.
- ii view: is NatWest now in better shape than rivals?
- Take control of your retirement planning with our award-winning, low-cost Self-Invested Personal Pension (SIPP)
I believe the shares are being accumulated by smart money since the March coronavirus crash lows. If so, my first target is the 36p area with higher potential. A simple 50% correction of the wave down off the December high produces a further target around 48p.
If there is more downside first, I do not see much potential for large losses. In fact, trading under the current 29p mark would set up an even better opportunity.
For more information about Tramline Traders, or to take a three-week free trial, go to www.tramlinetraders.com.
John Burford is the author of the definitive text on his trading method, Tramline Trading. He is also a freelance contributor and not a direct employee of interactive investor.
These articles are provided for information purposes only. Occasionally, an opinion about whether to buy or sell a specific investment may be provided by third parties. The content is not intended to be a personal recommendation to buy or sell any financial instrument or product, or to adopt any investment strategy as it is not provided based on an assessment of your investing knowledge and experience, your financial situation or your investment objectives. The value of your investments, and the income derived from them, may go down as well as up. You may not get back all the money that you invest. The investments referred to in this article may not be suitable for all investors, and if in doubt, an investor should seek advice from a qualified investment adviser.
Full performance can be found on the company or index summary page on the interactive investor website. Simply click on the company's or index name highlighted in the article.
Disclosure
We use a combination of fundamental and technical analysis in forming our view as to the valuation and prospects of an investment. Where relevant we have set out those particular matters we think are important in the above article, but further detail can be found here.
Please note that our article on this investment should not be considered to be a regular publication.
Details of all recommendations issued by ii during the previous 12-month period can be found here.
ii adheres to a strict code of conduct. Contributors may hold shares or have other interests in companies included in these portfolios, which could create a conflict of interests. Contributors intending to write about any financial instruments in which they have an interest are required to disclose such interest to ii and in the article itself. ii will at all times consider whether such interest impairs the objectivity of the recommendation.
In addition, individuals involved in the production of investment articles are subject to a personal account dealing restriction, which prevents them from placing a transaction in the specified instrument(s) for a period before and for five working days after such publication. This is to avoid personal interests conflicting with the interests of the recipients of those investment articles.