Chart of the week: is this energy stock at a turning point?
As the world drives down carbon emissions, fuel cells have a major role to play.
29th March 2021 15:45
by John Burford from interactive investor
As the world drives down carbon emissions, fuel cells have a major role to play.

The whole world is in thrall to the drive to reduce CO2 emissions, and FuelCell Energy (NASDAQ:FCEL) is an interesting company to consider.
These emissions mostly come from internal combustion engines and power plants. Never mind the associated production of huge amounts of water vapour in this process – the most intense ‘greenhouse gas’ of all (which is conveniently overlooked in calculations of ‘climate change’ temperatures). But I digress...
- Your chance to win £1,000: take part in the Great British Retirement Survey
- ITM Power: a star of the green investor revolution
One technology to capture the CO2 from power plants that has been in development for some time is the fuel cell, and the company has been working on several iterations of the fuel cell process using various electrolytes.
It has several working prototypes. All it needs is a large commercially operating installation to attract more energy companies to the cause.
Naturally, if this carbon-capture technology satisfies the various ‘green’ government mandates, it would extend the life of existing coal and oil/gas power plants for a significant cost advantage over installing replacement wind and solar, despite the huge governments grants and tax subsidies available for the latter.
Another intriguing aspect of the company is its work in extracting hydrogen for use as a ‘clean’ fuel. There is much talk of the scope for using hydrogen to power vehicles, but no large-scale applications have emerged as yet.
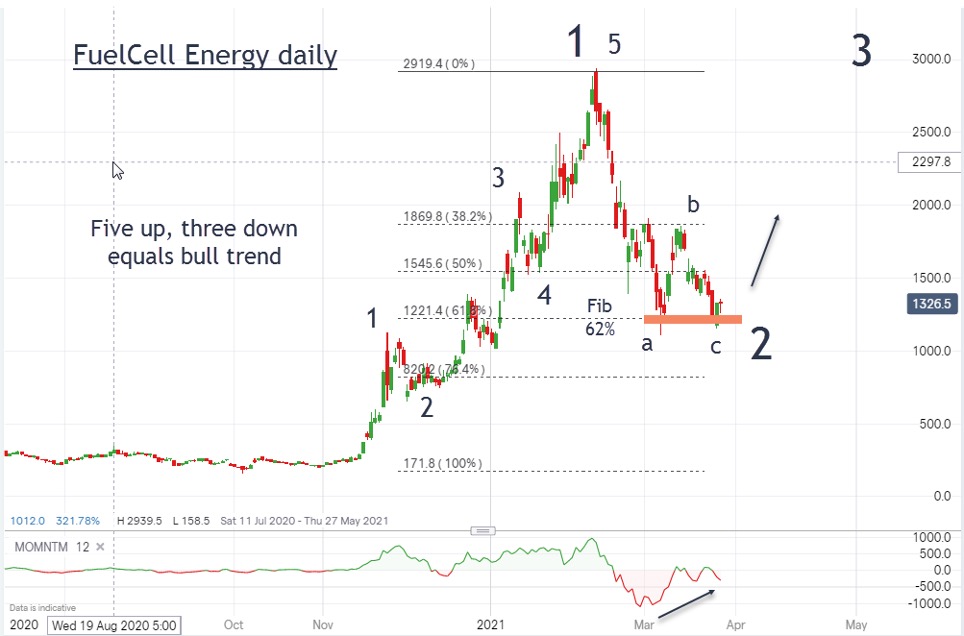
Sadly, carbon-capture shares have performed poorly as the initial excitement turned inevitably to dashed expectations. But I believe FCEL is poised to make significant advances now – and the timing couldn’t be better. Here is the daily chart:
Past performance is not a guide to future performance.
From the initial lift-off from the $3 (£2.17) area last November, it surged up in five clear waves to the 1 February high of $29 on the excitement generated by anticipated new contracts.
But when these were dashed, the shares fell back in three waves to the current $12 area, which is a Fibonacci 62% of the initial advance – a common retracement of an impulse (five) wave. Also, note the very large momentum divergence at the current ‘c’ wave low.
- New hydrogen economy ETF launches – too late to back this theme?
- Take control of your retirement planning with our award-winning, low-cost Self-Invested Personal Pension (SIPP)
Thus we have textbook conditions for a likely major turn up in a third wave that should exceed the span of the large wave one.
And given a tailwind then I set a target around the $35 area as a best-case scenario from the current $13. But if the $8 region is tested again, I will be forced to go back to the drawing board.
John Burford is the author of the definitive text on his trading method, Tramline Trading. He is also a freelance contributor and not a direct employee of interactive investor.
These articles are provided for information purposes only. Occasionally, an opinion about whether to buy or sell a specific investment may be provided by third parties. The content is not intended to be a personal recommendation to buy or sell any financial instrument or product, or to adopt any investment strategy as it is not provided based on an assessment of your investing knowledge and experience, your financial situation or your investment objectives. The value of your investments, and the income derived from them, may go down as well as up. You may not get back all the money that you invest. The investments referred to in this article may not be suitable for all investors, and if in doubt, an investor should seek advice from a qualified investment adviser.
Full performance can be found on the company or index summary page on the interactive investor website. Simply click on the company's or index name highlighted in the article.
Disclosure
We use a combination of fundamental and technical analysis in forming our view as to the valuation and prospects of an investment. Where relevant we have set out those particular matters we think are important in the above article, but further detail can be found here.
Please note that our article on this investment should not be considered to be a regular publication.
Details of all recommendations issued by ii during the previous 12-month period can be found here.
ii adheres to a strict code of conduct. Contributors may hold shares or have other interests in companies included in these portfolios, which could create a conflict of interests. Contributors intending to write about any financial instruments in which they have an interest are required to disclose such interest to ii and in the article itself. ii will at all times consider whether such interest impairs the objectivity of the recommendation.
In addition, individuals involved in the production of investment articles are subject to a personal account dealing restriction, which prevents them from placing a transaction in the specified instrument(s) for a period before and for five working days after such publication. This is to avoid personal interests conflicting with the interests of the recipients of those investment articles.