Chart of the week: FTSE 100 could do something spectacular very soon
Our technical analyst thinks the main index is about to break out of its current range. But which way?
27th April 2020 12:29
by John Burford from interactive investor
Our technical analyst thinks the main index is about to break out of its current range. But which way?

I remain bearish on the FTSE index – and here’s why
It has been two weeks (from 14 April) since I posted my bearish outlook for shares and, in that time, the FTSE 100 has moved precisely nowhere. But I believe it is only a matter of time before the next leg down begins.
As long-time readers know, I base my forecasts on a reading of the wave patterns already made on the charts and a reading of prevailing sentiment.
My basic iron-clad rule is that when sentiment becomes extremely bullish, I tend to look for tops and vice versa. Historically, that has been the consistent pattern throughout history.
The US markets are much better served than ours for providing internal market and sentiment data. In the US we have the weekly Commitment of Traders reports (COT) on the massive futures markets that gives hard numbers to the positioning of the speculators and the commercials.
Speculators – especially the hedge funds – are largely trend-followers and amass their largest net long positions near major tops.
And there is also a valuable survey undertaken daily of professional advisers about their bullish or bearish attitudes. This is the Daily Sentiment Index (DSI). Again, when that index gets too bullish or bearish, that is when trend changes tend to occur.
- The Week Ahead: UK banks, Shell, BP, Next, US tech
- 12 coronavirus stocks: another AIM share rallies 90%
- Take control of your retirement planning with our award-winning, low-cost Self-Invested Personal Pension (SIPP)
And it must seem perverse to those who believe that the news drives the markets, that tops are made when everyone is bullish.
It seems so obvious that the market should continue higher when all the news is favourable, such as we are seeing today.
Yes, everywhere you look, pundits proclaim that the worst of the pandemic effects are over or about to be so. Roll back to late February (it seems ages ago, doesn’t it?) and the vast majority of the pundits saw only clear blue skies with interest rates ever weakening and with full employment.
Many were forecasting the FTSE was poised to hit the 8,000 mark – and beyond.
That is what happens when excessive herding creates the perfect conditions for a top. And those conditions are being reproduced in today’s recovery.
One age-old feature of bull markets is that trading volumes expand as shares rise and trading volumes drop off in the dips. But look at this chart of the S&P with daily trading volumes plotted:
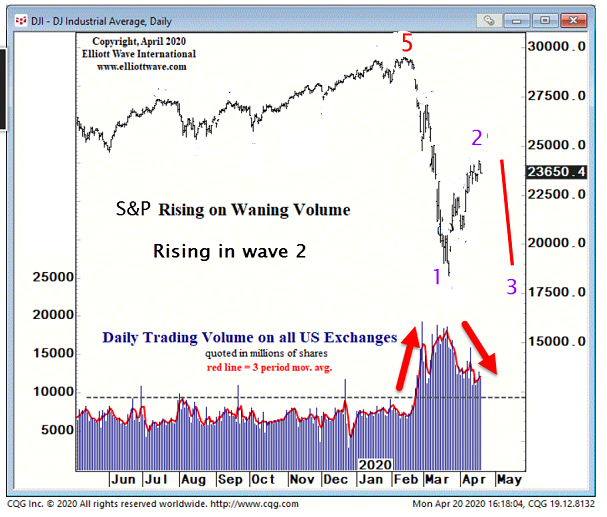
The market was still in its bull phase until February which started the Corona Crash. But look how trading volumes exploded on the move lower. That is not a bull market sign at all. And on the rebound, volumes are contracting – again not the sign of a bull market. In fact, this behaviour is entirely typical of a bear market.
And this behaviour is almost certainly mirrored in the FTSE which is now in a bear market. The wave patterns in the S&P also strongly point to this rally being a second wave.
In Elliott Wave Theory, we know a lot about second waves in bear markets. They tend to reproduce the extreme bullish feelings at the end of the rally early in the year and often end with a whimper on low volumes and low volatility. That’s when the devastating third wave down starts as the buying rush ends.
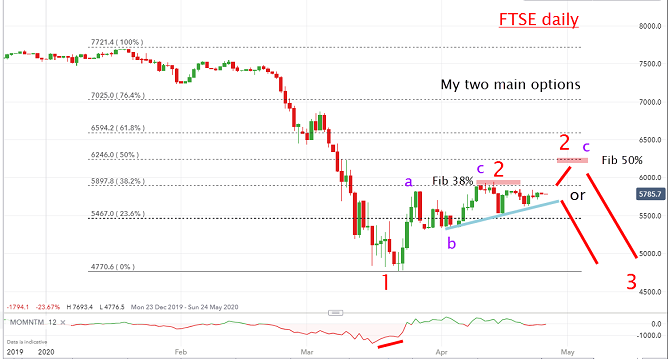
This one is certainly fitting this characteristic, so far. Here is the FTSE chart:
Source: interactive investor. Past performance is not a guide to future performance.
In the past two weeks, the index has remained within a narrow range but is about to break out. One option is for it to break down within days and move below the minor blue trendline in a strong wave 3.
But, if it catches a bid this week, it could possibly push up to the Fibonacci 50% retrace of the decline from January high to March low – at around the 6,250 area - before reversing down in wave 3.
Either way, wave 2’s days are numbered. Only a strong rally well above the Fib 62% at 6,600 would send me back to the drawing board.
US markets have made deeper retrenchments into the decline with moves slightly beyond the Fib 50% retracements in the Dow and S&P. And both display a very similar pattern.
And finally, my prediction for crude oil to reach the $12 area has been well and truly fulfilled. This was my forecast in my COTW of 20 March, when oil was trading at $23:
“Shell (LSE:RDSB) has just made a new 20-year low under £10. The wave labels are pretty clear – we are in a very extended third wave down. When it terminates, I expect a bounce in wave 4 and then move to new lows in wave 5 with crude oil moving possibly to the $12 range.”
Last week, crude made bizarre headlines with a negative price for the nearby contract for the first time in history. And what a time to prove to the world that the global economy is in severe deflation while many pundits expect inflation. Hmm.
For more information about Tramline Traders, or to take a three-week free trial, go to www.tramlinetraders.com.
John Burford is the author of the definitive text on his trading method, Tramline Trading. He is also a freelance contributor and not a direct employee of interactive investor.
These articles are provided for information purposes only. Occasionally, an opinion about whether to buy or sell a specific investment may be provided by third parties. The content is not intended to be a personal recommendation to buy or sell any financial instrument or product, or to adopt any investment strategy as it is not provided based on an assessment of your investing knowledge and experience, your financial situation or your investment objectives. The value of your investments, and the income derived from them, may go down as well as up. You may not get back all the money that you invest. The investments referred to in this article may not be suitable for all investors, and if in doubt, an investor should seek advice from a qualified investment adviser.
Full performance can be found on the company or index summary page on the interactive investor website. Simply click on the company's or index name highlighted in the article.
Disclosure
We use a combination of fundamental and technical analysis in forming our view as to the valuation and prospects of an investment. Where relevant we have set out those particular matters we think are important in the above article, but further detail can be found here.
Please note that our article on this investment should not be considered to be a regular publication.
Details of all recommendations issued by ii during the previous 12-month period can be found here.
ii adheres to a strict code of conduct. Contributors may hold shares or have other interests in companies included in these portfolios, which could create a conflict of interests. Contributors intending to write about any financial instruments in which they have an interest are required to disclose such interest to ii and in the article itself. ii will at all times consider whether such interest impairs the objectivity of the recommendation.
In addition, individuals involved in the production of investment articles are subject to a personal account dealing restriction, which prevents them from placing a transaction in the specified instrument(s) for a period before and for five working days after such publication. This is to avoid personal interests conflicting with the interests of the recipients of those investment articles.