Chart of the week: a FTSE 100 share on verge of major rally phase?
7th November 2022 12:46
by John Burford from interactive investor
After a volatile year so far, this company could be about to do something exciting, believes analyst John Burford who sees great upside potential.

Is Fresnillo about to break higher?
I am returning to FTSE 100 silver miner Fresnillo (LSE:FRES) now because it appears to be on the verge of a major rally phase, awakening from a deep slumber.
There is little doubt that the precious metals, including silver, have been in the doldrums in recent weeks. To many, this is extremely puzzling since it is commonly thought that in a period of high inflation, such as that we are experiencing, these commodities perform extremely well.
- Read about: Free regular investing | ii Super 60 Investments | Cashback Offers
In fact, if you examine the historical record over decades, you will find that sometimes they do and sometimes they don't. Obviously, there are factors at work other than the headline inflation rate. Note: I am using the common CPI data as a proxy for inflation (which is in reality a measure of the changes in money and credit supply).
Another myth surrounding the precious metals is that high interest rates dampen the attractions of holding them with their higher carrying costs. Again, the record shows that sometimes that holds true and sometimes it does not.
- Investors stunned as Federal Reserve issues threat in war on inflation
- A share to buy, another to sell and one to hold
One glaring other factor at play today is, of course, the strong dollar. Measured in currencies other than the US dollar, the precious metals have performed well.
But last week, the US dollar and the precious metals reacted very strongly to Friday's US non-farm jobs data that showed a continued hot labour market. In fact, the reaction was perverse in that the implied strong US economy would normally indicate no Federal Reserve 'pivot' soon, with interest rates zooming higher, dragging the dollar up in its wake. So much for the near-universal theory that the news makes the market (it follows it!).
Past performance is not a guide to future performance.
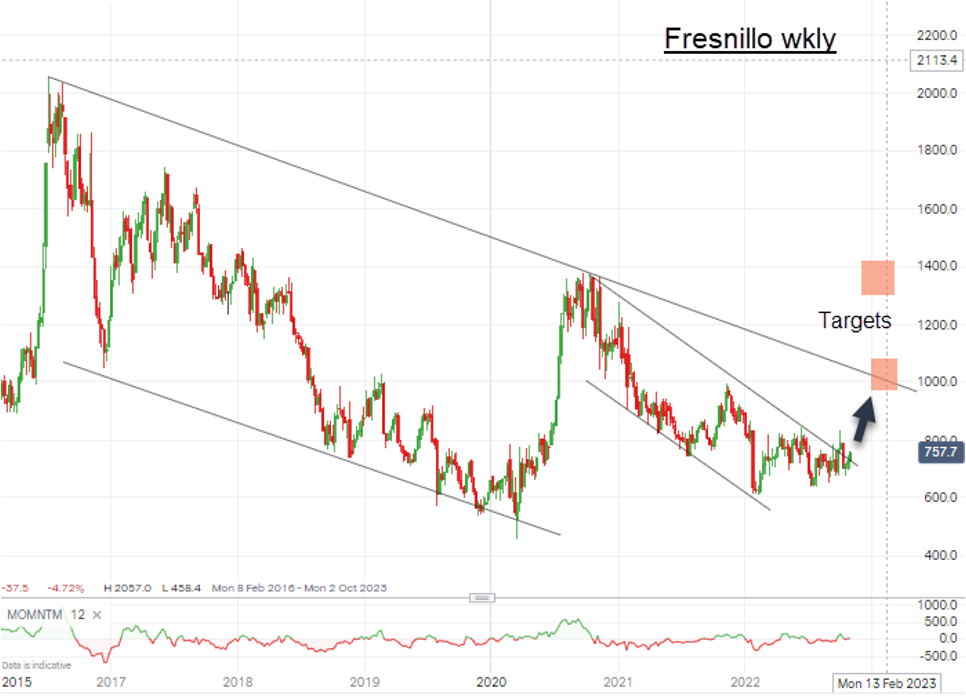
This is the weekly chart going back to 2016 with my excellent tramlines drawn. On this scale, the strong 8% share price surge on Friday can hardly be seen – but it did take it to the upper line of my smaller tramline pair. Thus, only a smaller nudge soon would very likely send it up towards my first target around the £10 mark.
Past performance is not a guide to future performance.
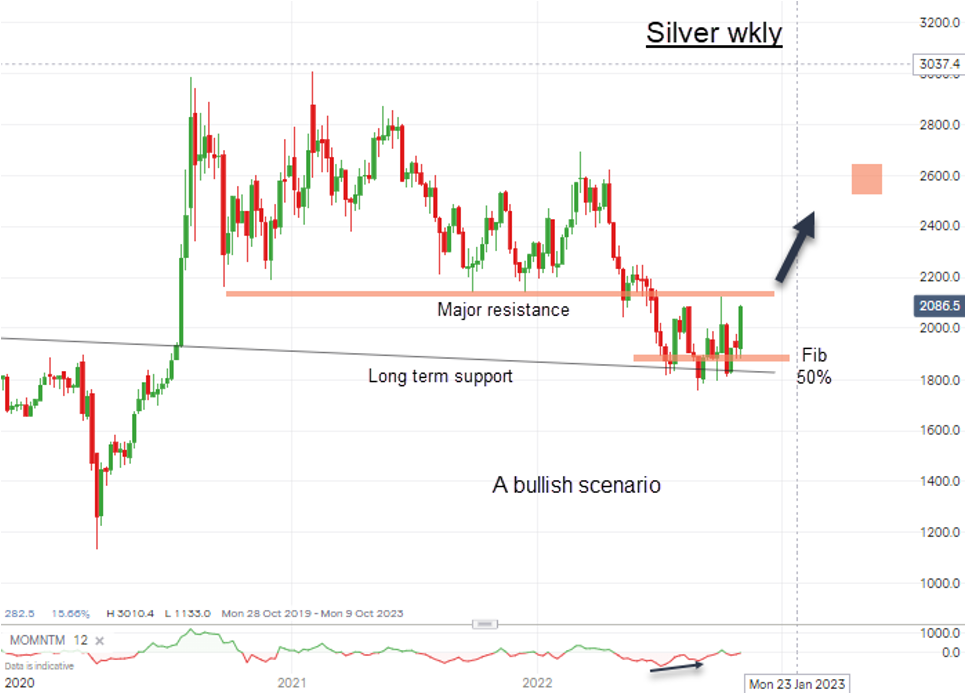
Here is the weekly silver chart that shows the market has been testing the major long-term support at the Fibonacci 50% retrace and, with Friday's surge, is approaching a test of the major resistance slightly above the current $21.
A successful break of that resistance would likely send it up to my target around $26, with Fresnillo shares advancing in tandem upwards to my first target around £10.
As interest rates have risen dramatically in recent weeks from near zero to over a 4% yield on three-month Treasury bills this year, the precious metals have actually held their ground quite well, especially since the summer. That tells me there has been a large distribution into safer hands (the 'smart' money).
I view the downside in Fresnillo as limited, while the upside has great potential. Only a move below the £6 level would send me back to my drawing board.
John Burford is a freelance contributor and not a direct employee of interactive investor.
These articles are provided for information purposes only. Occasionally, an opinion about whether to buy or sell a specific investment may be provided by third parties. The content is not intended to be a personal recommendation to buy or sell any financial instrument or product, or to adopt any investment strategy as it is not provided based on an assessment of your investing knowledge and experience, your financial situation or your investment objectives. The value of your investments, and the income derived from them, may go down as well as up. You may not get back all the money that you invest. The investments referred to in this article may not be suitable for all investors, and if in doubt, an investor should seek advice from a qualified investment adviser.
Full performance can be found on the company or index summary page on the interactive investor website. Simply click on the company's or index name highlighted in the article.
Disclosure
We use a combination of fundamental and technical analysis in forming our view as to the valuation and prospects of an investment. Where relevant we have set out those particular matters we think are important in the above article, but further detail can be found here.
Please note that our article on this investment should not be considered to be a regular publication.
Details of all recommendations issued by ii during the previous 12-month period can be found here.
ii adheres to a strict code of conduct. Contributors may hold shares or have other interests in companies included in these portfolios, which could create a conflict of interests. Contributors intending to write about any financial instruments in which they have an interest are required to disclose such interest to ii and in the article itself. ii will at all times consider whether such interest impairs the objectivity of the recommendation.
In addition, individuals involved in the production of investment articles are subject to a personal account dealing restriction, which prevents them from placing a transaction in the specified instrument(s) for a period before and for five working days after such publication. This is to avoid personal interests conflicting with the interests of the recipients of those investment articles.