Chart of the week: has Amazon peaked?
2nd August 2021 15:19
by John Burford from interactive investor
Our expert considers whether the online shopping titan’s shares are running out of road in the near term.

Last week, the juggernaut that is Amazon (NASDAQ:AMZN) reported its latest results. They were stellar by most accounts.
So why did the shares suffer a massive 13% sell-off? Yes, all the usual pundits claimed the results were 'disappointing' – but that was after the announcement when the shares were sinking.
If the shares had risen on the back of the reported solid growth in Prime members and the increase in its share of e-commerce, you can be certain they would have pulled a different set of conclusions out of their drawer marked Handy Market Rationalisations for all Occasions!
You can also guarantee the word 'despite' would have featured heavily.
- ii view: why Amazon shares just got 7% cheaper
- Should investors prepare for an autumn market correction?
They would have found perfectly reasonable reasons why the shares rose – after all, cloud services grew by a very impressive 37% - greater than expected. Why didn't the shares rise on that data?
I have a different way of looking at the markets – and that is forward-looking. And is not dependent on the data.
Trying to understand share market moves – and base forecasts – on the basis of the data leads you up the garden path on a wild goose chase. Which data to choose and which to ignore? And how to interpret it?
As it is such an important share, I track it regularly and for some time have identified it as likely forming a chart pattern that often signals a reversal ahead.
Past performance is not a guide to future performance.
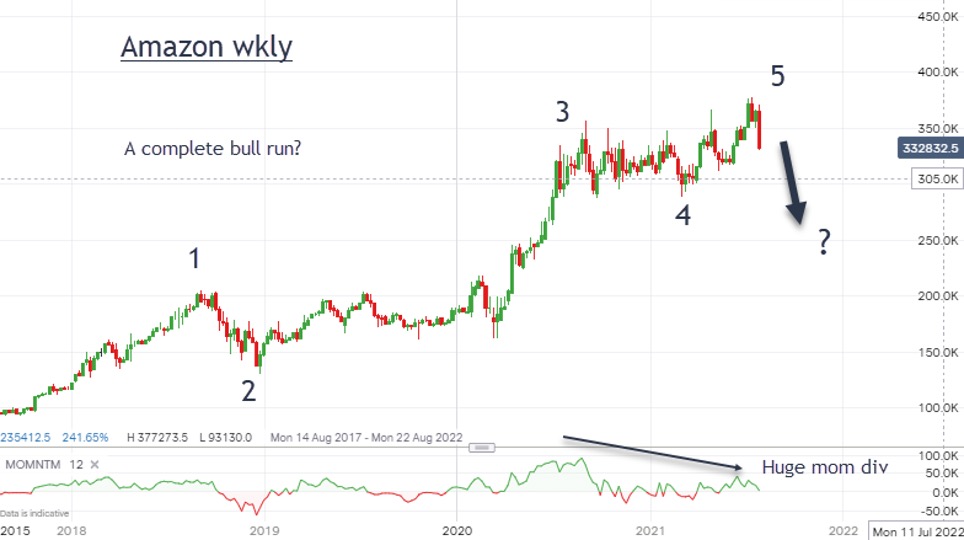
This is the weekly chart going back to 2018 and I have a valid five-wave bull run that should be complete.
Wave 3 has the typical 'long and strong' characteristic that this wave possesses. Note that the maximum momentum reading (also known as 'strength') occurred at the wave 3 high, which is normal.
Then, wave 4 was another wave that has typical features of that wave number in that it is lengthy and complex but has a three-wave overall identity.
Finally, the final thrust in wave 5 has occurred on weaker momentum than that at the wave 3 high.
Fifth waves (to new ATHs) almost always occur on weaker momentum than in third waves. The leaders thin out in wave 5.
This has produced a trademark 'momentum divergence' that often signals the end of the bull run as buying exhaustion sets in.
And given that a large 'mom div' often heralds strong action when a trend reverses, it was not surprising the shares have fallen by the whopping 13% in the past two weeks. That action was completely foreseeable to anyone following the waves and the momentum leading up to the Thursday results. No amount of data research could have hinted at that.
I believe that we have seen at least a major high in Amazon at the $3,780 level on 13 July.
With the shares now trading at the $3,330 mark, odds are growing that this high will not be exceeded for a good while and prudence suggests some profit taking would be in order especially on any bounce.
John Burford is the author of the definitive text on his trading method, Tramline Trading. He is also a freelance contributor and not a direct employee of interactive investor.
These articles are provided for information purposes only. Occasionally, an opinion about whether to buy or sell a specific investment may be provided by third parties. The content is not intended to be a personal recommendation to buy or sell any financial instrument or product, or to adopt any investment strategy as it is not provided based on an assessment of your investing knowledge and experience, your financial situation or your investment objectives. The value of your investments, and the income derived from them, may go down as well as up. You may not get back all the money that you invest. The investments referred to in this article may not be suitable for all investors, and if in doubt, an investor should seek advice from a qualified investment adviser.
Full performance can be found on the company or index summary page on the interactive investor website. Simply click on the company's or index name highlighted in the article.
Disclosure
We use a combination of fundamental and technical analysis in forming our view as to the valuation and prospects of an investment. Where relevant we have set out those particular matters we think are important in the above article, but further detail can be found here.
Please note that our article on this investment should not be considered to be a regular publication.
Details of all recommendations issued by ii during the previous 12-month period can be found here.
ii adheres to a strict code of conduct. Contributors may hold shares or have other interests in companies included in these portfolios, which could create a conflict of interests. Contributors intending to write about any financial instruments in which they have an interest are required to disclose such interest to ii and in the article itself. ii will at all times consider whether such interest impairs the objectivity of the recommendation.
In addition, individuals involved in the production of investment articles are subject to a personal account dealing restriction, which prevents them from placing a transaction in the specified instrument(s) for a period before and for five working days after such publication. This is to avoid personal interests conflicting with the interests of the recipients of those investment articles.