Chart of the week: has Apple finally reached its peak?
Apple led the tech market rally, but its shares now look overvalued and a crash might be coming.
10th August 2020 12:56
by John Burford from interactive investor
Apple led the tech market rally, but its shares now look overvalued. Our technical analyst believes a crash might be coming.
Most say that picking market tops is a fool’s game – and most of the time they are right.
Get the timing wrong and much egg lands on your face. Get it right and everyone says “it was obvious” after the event - with few plaudits awarded to the hapless forecaster.
With this unpromising scenario, I find I cannot resist the urge to call a high in Apple (NASDAQ:AAPL), as the undoubted leader of the stunning market rally of recent years.
Apple is one of the handful of big name US tech shares many consider ‘must have’ holdings. Even Warren Buffett – who famously shunned tech in the 1990s boom years – has a massive holding.
So with everyone and his dog owning shares, it is a stunning fact that its market cap now is almost 90% of the entire cap of the Russell 2000 index (an index of 2,000 of the largest US domestic companies). Never has a single stock reached these giddy heights in comparison with a major index – not even IBM in 1979, when it ruled the tech roost.
Take a moment to reflect on that. And remember, all Apple does is sell (very expensive) communication devices that almost everyone on the planet owns in one form or another. And it is not short of competitors!
- Chart of the week: a second chance to sell Apple
- Stockwatch: have Microsoft shares finally peaked?
- ii view: Covid fuels Apple sales
A very good case can be made that Apple shares are hugely overvalued and buying (or holding) them here represents a very poor risk/reward outlook.
So what evidence do I have to suggest the top is nigh? Here is the long-term monthly chart showing the exponential rocket-like surge that is typical of the late stages of a buying mania:
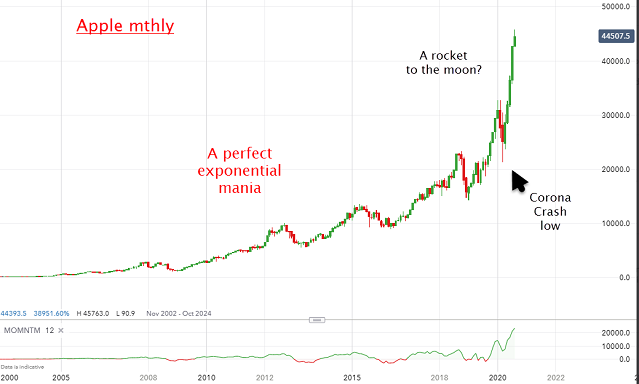
Source: interactive investor. Past performance is not a guide to future performance.
I have yet to see a vertical wall resolve in a whimper – they always result in a crash. That is what the odds favour with Apple, difficult to believe though it may be for many, who may view this as heresy.
Looking at the shorter-term picture:
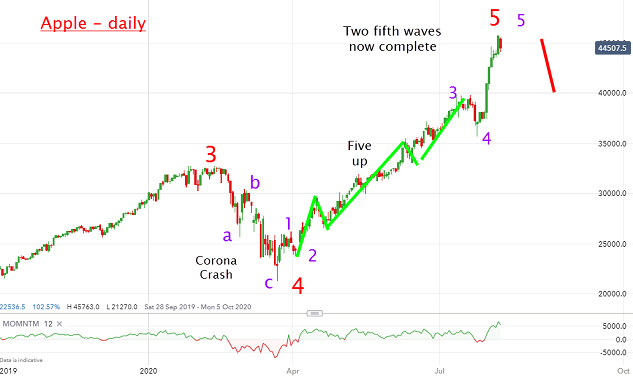
Source: interactive investor. Past performance is not a guide to future performance.
I have a potentially complete five waves in at least two degrees of scale on the Elliott Wave picture. That is a clear indication that a major turn approaches and any upside from here is extremely limited. A downside correction could quickly shave at least 10-15% off the value, with bigger corrections possible.
- US results reporting season: reaction to bank and tech sector numbers
- An easier way to invest in the US
- Want to buy and sell international shares? It’s easy to do. Here’s how
- Take control of your retirement planning with our award-winning, low-cost Self-Invested Personal Pension (SIPP)
My best guess is that if it can breach the $350 support in the days and weeks ahead, the Corona Crash low at $200 will be within sight. In any case, taking major profits here would be prudent.
Bullish investors who may be carried away by their supreme confidence should remember the Golden Rule of investing – to prosper, Buy Low and Sell High. The ‘Sell High’ part is usually the most difficult to achieve emotionally.
For more information about Tramline Traders, or to take a three-week free trial, go to www.tramlinetraders.com.
John Burford is the author of the definitive text on his trading method, Tramline Trading. He is also a freelance contributor and not a direct employee of interactive investor.
These articles are provided for information purposes only. Occasionally, an opinion about whether to buy or sell a specific investment may be provided by third parties. The content is not intended to be a personal recommendation to buy or sell any financial instrument or product, or to adopt any investment strategy as it is not provided based on an assessment of your investing knowledge and experience, your financial situation or your investment objectives. The value of your investments, and the income derived from them, may go down as well as up. You may not get back all the money that you invest. The investments referred to in this article may not be suitable for all investors, and if in doubt, an investor should seek advice from a qualified investment adviser.
Full performance can be found on the company or index summary page on the interactive investor website. Simply click on the company's or index name highlighted in the article.
Disclosure
We use a combination of fundamental and technical analysis in forming our view as to the valuation and prospects of an investment. Where relevant we have set out those particular matters we think are important in the above article, but further detail can be found here.
Please note that our article on this investment should not be considered to be a regular publication.
Details of all recommendations issued by ii during the previous 12-month period can be found here.
ii adheres to a strict code of conduct. Contributors may hold shares or have other interests in companies included in these portfolios, which could create a conflict of interests. Contributors intending to write about any financial instruments in which they have an interest are required to disclose such interest to ii and in the article itself. ii will at all times consider whether such interest impairs the objectivity of the recommendation.
In addition, individuals involved in the production of investment articles are subject to a personal account dealing restriction, which prevents them from placing a transaction in the specified instrument(s) for a period before and for five working days after such publication. This is to avoid personal interests conflicting with the interests of the recipients of those investment articles.