Chart of the week: has Tesla met its final Wall of Worry?
6th December 2021 11:37
by John Burford from interactive investor
After hitting a record high last month, Tesla shares have struggled. Technical analyst John Burford draws up new charts to see where the stock price might go next.
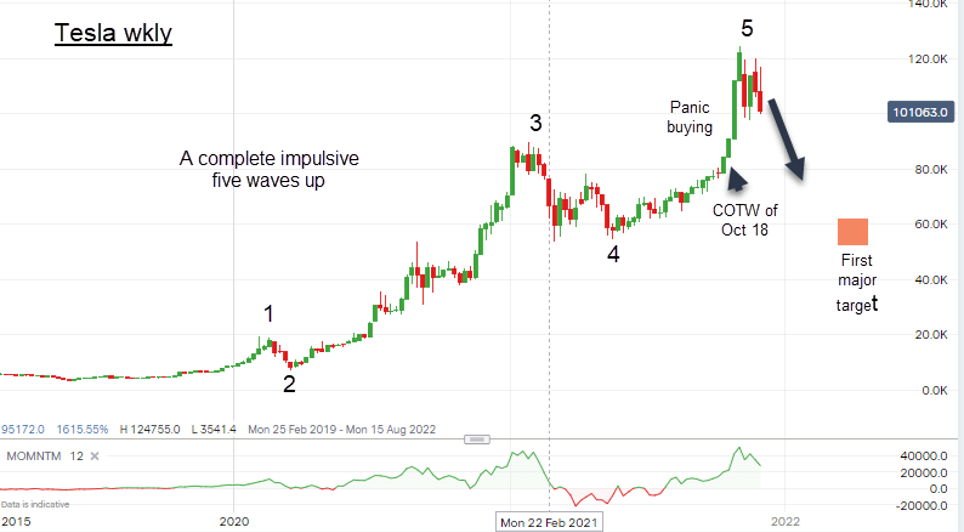
In my COTW of 18 October, I had a very firm forecast that from the current price at the $850 area, Tesla (NASDAQ:TSLA) shares would advance above the previous all-time high set in January at $900 in a final fifth termination wave. My stated prediction was that when that wave terminated, it would enter a solid downtrend. Events since then have lined up well with that forecast. Investors were thus offered a rationale for taking profits.
Recall the chart I posted in October:
Past performance is not a guide to future performance.
But I confess these labels are only part correct as far as they go except that my wave 5 high at the all-time high also carries a much more likely wave 3 label of a larger count. In other words, the a-b-c correction comprises wave 4 and my forecast to a new high is the final fifth wave stands, as I stated.
- Read more articles by John Burford here
- Watch our latest Chart Show: FTSE 100, easyJet, Twitter
- A new electric vehicle boom starts now: back these shares
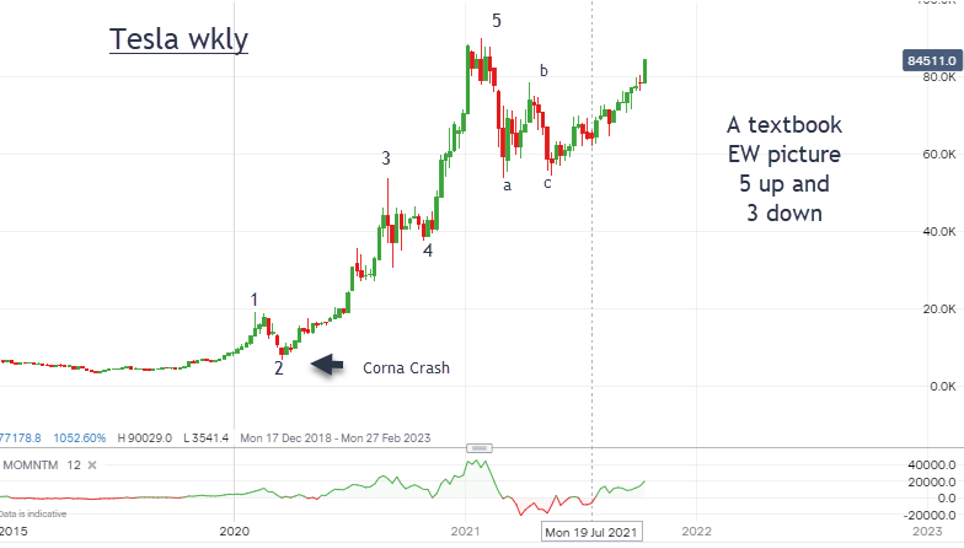
Remember, the basic tenet of Elliott Wave theory is that when a trend (up or down) has traced out a strong five-wave pattern, the next major move is a decline in three waves (or variation thereof). I call this the 'five up, three down Rule'. It can be observed in any time scale.
One more rule is that when bullish sentiment reaches an extreme (where all or most of the data point up), that is where major corrections often start. Traders (and Mr Musk) use this observation to take profits when everyone else is buying (near the top).
Here is the chart updated with my much more likely labels:
Past performance is not a guide to future performance.
Indeed, the shares did move much higher in wave 5 to the high at $1,240 on 4 November. In fact, the advance from my October COTW was almost vertical (a buying panic)! It followed the release of the latest sales figures that put the Tesla Model 3 as the best selling car in September – pushing the ever-popular Renault Clio into second place.
It seemed then that Tesla would take over the world! Imagine – a very expensive electric vehicle (EV) outselling an established, much-loved and much cheaper internal combustion engine (ICE) model. And its name isn't even designed to set the pulse racing!
But just as the sky seemed to be the limit for Tesla, a brick wall appeared in the form of the infamous Twitter 'referendum' that ordered Musk to divest 10% of his holding – a not inconsiderable pile of shares and options. The shares were then trading around the $1,240 high.
So was that the final Wall of Worry the shares could not scramble over?
- Friends & Family: ii customers can give up to 5 people a free subscription to ii, for just £5 a month extra. Learn more
- Tesla and the electric car revolution
- Subscribe to the ii YouTube channel for our latest interviews
Suddenly, more ‘walls’ are popping up from the recent worry over lithium supplies and the rocketing price of copper and aluminium.
And here in the UK, the recent storm has knocked out power supplies for more than a week to northern regions where the Teslas are going nowhere fast (while ICE vehicles remain mobile). That surely has not helped driver sentiment to switch.
That is highlighting the immense cost of upgrading the capacity of the national grid to accommodate the planned take-over of EVs.
All of a sudden, the outlook for EVs is not so rosy and a decent reality check is due.
John Burford is the author of the definitive text on his trading method, Tramline Trading. He is also a freelance contributor and not a direct employee of interactive investor.
These articles are provided for information purposes only. Occasionally, an opinion about whether to buy or sell a specific investment may be provided by third parties. The content is not intended to be a personal recommendation to buy or sell any financial instrument or product, or to adopt any investment strategy as it is not provided based on an assessment of your investing knowledge and experience, your financial situation or your investment objectives. The value of your investments, and the income derived from them, may go down as well as up. You may not get back all the money that you invest. The investments referred to in this article may not be suitable for all investors, and if in doubt, an investor should seek advice from a qualified investment adviser.
Full performance can be found on the company or index summary page on the interactive investor website. Simply click on the company's or index name highlighted in the article.
Disclosure
We use a combination of fundamental and technical analysis in forming our view as to the valuation and prospects of an investment. Where relevant we have set out those particular matters we think are important in the above article, but further detail can be found here.
Please note that our article on this investment should not be considered to be a regular publication.
Details of all recommendations issued by ii during the previous 12-month period can be found here.
ii adheres to a strict code of conduct. Contributors may hold shares or have other interests in companies included in these portfolios, which could create a conflict of interests. Contributors intending to write about any financial instruments in which they have an interest are required to disclose such interest to ii and in the article itself. ii will at all times consider whether such interest impairs the objectivity of the recommendation.
In addition, individuals involved in the production of investment articles are subject to a personal account dealing restriction, which prevents them from placing a transaction in the specified instrument(s) for a period before and for five working days after such publication. This is to avoid personal interests conflicting with the interests of the recipients of those investment articles.