Chart of the week: how to play a predicted gold price rally
20th September 2022 13:22
by John Burford from interactive investor
Selling has been intense the past six months, but a key indicator has hit a level where previous readings have signalled major advances. Analyst John Burford explains.

Is it time to buy the gold miners?
The precious metals (PMs) are having a torrid time – and no wonder, when interest rates are climbing and many expect a global recession soon. And with the metals priced in US dollars, the currency’s well-publicised strength has been an additional headwind. But are conditions set to change for the better soon?
Yes, there seems little reason to be bullish on the PMs or the miners on the face of it. And that is reflected in the mostly lack of investor interest in US gold mining shares. And I note that the mainstream media has gone very quiet on PMs – so is this relative silence a clue that the bear trends are coming to an end?
- Read about how to: Open a Trading Account | How to start Trading Stocks | Top UK shares
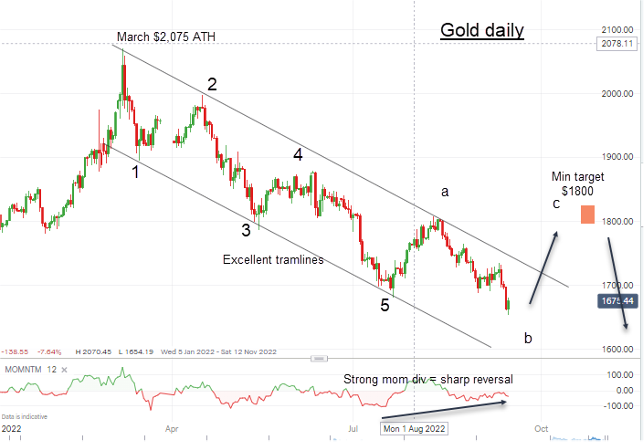
Gold has fallen off its $2,075 all-time high in March to this week's $1,655 low – a loss of $420 (20%). In that time, the US Dollar Index has appreciated by 15%, making the loss much less severe when measured against the euro, for example.
In the six-month gold bear trend, selling has been intense, but currently one measure of bullish sentiment places it near an extreme from where previous low readings have signalled major advances. Here is the daily gold chart of the decline off the March high:
Past performance is not a guide to future performance.
The stand-out feature is the excellent pair of tramlines joining the major highs (resistance) and lows (support). These highs and lows all accurately touch their lines, which gives strong validity to them as future targets for support and/or resistance.
Also, note the wave pattern that strongly suggests the market is completing a wave ‘b’ low prior to an upwards surge in a ‘c’ wave, and this surge should be very strong given the large momentum divergence that is building.
When wave ‘b’ does terminate, my major target is the $1,800 region ($145 above current).
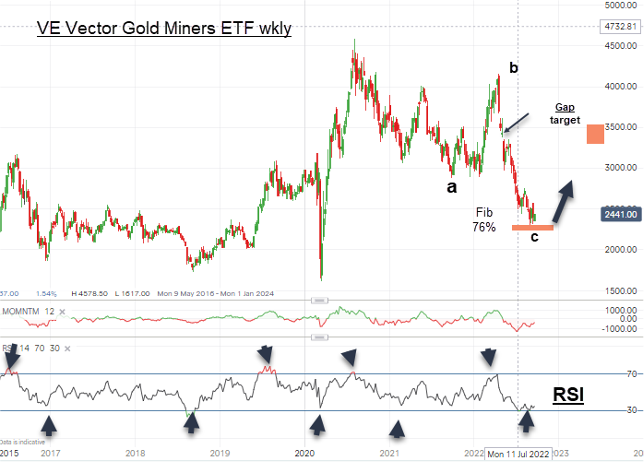
With this background, how are the gold miners shaping up for a rally phase? Here is a very popular gold ETF – the VanEck Gold Miners ETF (LSE:GDX) (latest $24.40):
Past performance is not a guide to future performance.
Note the record high was set in August 2020 and failed to make a new high above that when gold surged to its high in March of this year. That was when my wave ‘b’ top occurred.
But of great interest is the action of the RSI (Relative Strength Indicator) in the lower section. One of the rules for using it as a signal for a trend change is to note when it rises above the 70 level (overbought), or when it falls below the 30 level (oversold).
Note the arrows that indicate the major highs and lows accurately on these occasions – and today, the RSI is testing to 30 low. The market is oversold.
And the form of the current wave pattern matches that of the metal with an a-b-c in formation.
Last week, the shares fell to the Fibonacci 76% support level – a common ‘last chance saloon’ level for a possible reversal.
On Wednesday, the Federal Reserve will issue its hotly awaited statement on interest rate policy (among other matters, such as the pace of quantitative tightening), and the market is expecting another 75-basis point hike, with some looking for 100 bps.
But even a slight deviation from a very hawkish stance would very likely induce buying of the dollar and the PMs.
John Burford is a freelance contributor and not a direct employee of interactive investor.
These articles are provided for information purposes only. Occasionally, an opinion about whether to buy or sell a specific investment may be provided by third parties. The content is not intended to be a personal recommendation to buy or sell any financial instrument or product, or to adopt any investment strategy as it is not provided based on an assessment of your investing knowledge and experience, your financial situation or your investment objectives. The value of your investments, and the income derived from them, may go down as well as up. You may not get back all the money that you invest. The investments referred to in this article may not be suitable for all investors, and if in doubt, an investor should seek advice from a qualified investment adviser.
Full performance can be found on the company or index summary page on the interactive investor website. Simply click on the company's or index name highlighted in the article.
Disclosure
We use a combination of fundamental and technical analysis in forming our view as to the valuation and prospects of an investment. Where relevant we have set out those particular matters we think are important in the above article, but further detail can be found here.
Please note that our article on this investment should not be considered to be a regular publication.
Details of all recommendations issued by ii during the previous 12-month period can be found here.
ii adheres to a strict code of conduct. Contributors may hold shares or have other interests in companies included in these portfolios, which could create a conflict of interests. Contributors intending to write about any financial instruments in which they have an interest are required to disclose such interest to ii and in the article itself. ii will at all times consider whether such interest impairs the objectivity of the recommendation.
In addition, individuals involved in the production of investment articles are subject to a personal account dealing restriction, which prevents them from placing a transaction in the specified instrument(s) for a period before and for five working days after such publication. This is to avoid personal interests conflicting with the interests of the recipients of those investment articles.