Chart of the week: I remain bullish on these two shares
After tracking this pair since last year, our technical analyst still sees significant upside potential.
24th February 2020 14:08
by John Burford from interactive investor
After tracking this pair since last year, our technical analyst still sees significant upside potential.

Canopy Growth and Tilray – still rising from the ashes?
I last covered Canopy Growth (TSE:WEED) on 20 January, which was a follow-up to my first coverage on 11 November last year when I spotted it as a likely Buy Low/Sell High candidate on good timing.
Of course, almost anyone can look over charts and spot bear trends and proclaim: ‘Yes, I have a Buy Low/Sell High share!’. But unless you have a tried and tested system of separating the wheat from the chaff, you are likely to end up with cut fingers as you had really caught a falling knife!
And catching a falling knife is OK, just so long as you have a stop loss in place as a bandage.
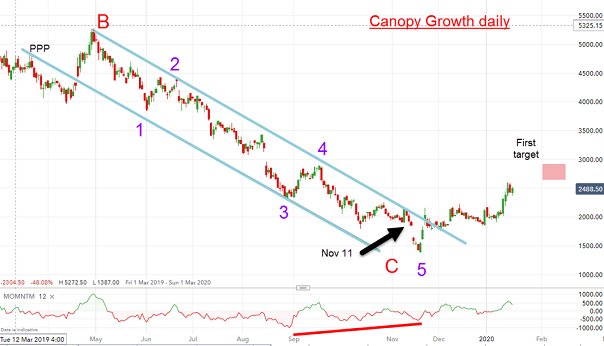
So, did I catch a falling knife here or did I latch on to a good trade? This was the chart I showed last month:
Source: interactive investor Past performance is not a guide to future performance
I noted that I was a little premature in November to call the low, but it appeared very soon thereafter, and that $18.50 low was the completion of a lovely five-wave pattern. In just a couple of days, the huge momentum divergence propelled the price out of the trading channel to offer a bull signal.
This what I wrote in November: “And the Drake news on Friday helped push the market above my upper tramline in what should be the start of a bull phase with my first target around the $20 region with higher potential thereafter. With short interest still very high, I believe odds strongly favour further advances.”
My 20 January note:
“My first $20 target has been achieved and now it is advancing towards my next target at the $29 - $30 region. The high short interest should provide the fuel.”
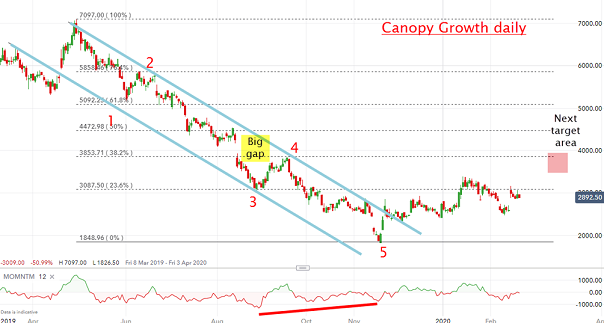
Here is the updated chart:
Source: interactive investor Past performance is not a guide to future performance
In fact, my target was reached – and then some - to the $33.50 high from where it has been in consolidation mode.
But note the large gap up ahead in the $40 region, which has now become my main target. Depending on the wave pattern up ahead, I may claim this to be a major top and a place to take profits.
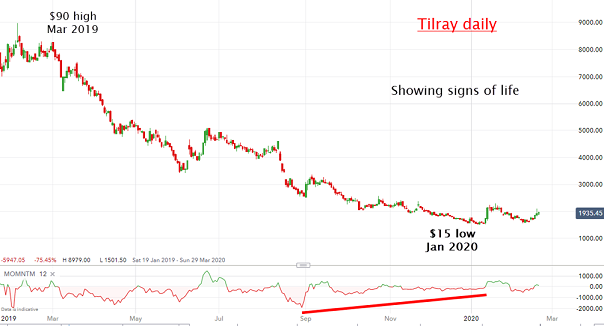
So how is the sister ‘pot stock’ Tilray (NASDAQ:TLRY) performing?
Source: interactive investor Past performance is not a guide to future performance
It too has a large momentum divergence to the $15 low and thus has fuel to propel it up to my next target around the $30 area.
I remain bullish on these two shares.
For more information about Tramline Traders, or to take a three-week free trial, go to www.tramlinetraders.com.
John Burford is the author of the definitive text on his trading method, Tramline Trading. He is also a freelance contributor and not a direct employee of interactive investor.
These articles are provided for information purposes only. Occasionally, an opinion about whether to buy or sell a specific investment may be provided by third parties. The content is not intended to be a personal recommendation to buy or sell any financial instrument or product, or to adopt any investment strategy as it is not provided based on an assessment of your investing knowledge and experience, your financial situation or your investment objectives. The value of your investments, and the income derived from them, may go down as well as up. You may not get back all the money that you invest. The investments referred to in this article may not be suitable for all investors, and if in doubt, an investor should seek advice from a qualified investment adviser.
Full performance can be found on the company or index summary page on the interactive investor website. Simply click on the company's or index name highlighted in the article.
Disclosure
We use a combination of fundamental and technical analysis in forming our view as to the valuation and prospects of an investment. Where relevant we have set out those particular matters we think are important in the above article, but further detail can be found here.
Please note that our article on this investment should not be considered to be a regular publication.
Details of all recommendations issued by ii during the previous 12-month period can be found here.
ii adheres to a strict code of conduct. Contributors may hold shares or have other interests in companies included in these portfolios, which could create a conflict of interests. Contributors intending to write about any financial instruments in which they have an interest are required to disclose such interest to ii and in the article itself. ii will at all times consider whether such interest impairs the objectivity of the recommendation.
In addition, individuals involved in the production of investment articles are subject to a personal account dealing restriction, which prevents them from placing a transaction in the specified instrument(s) for a period before and for five working days after such publication. This is to avoid personal interests conflicting with the interests of the recipients of those investment articles.