Chart of the week: is it time to take profits in Lloyds?
The stock has run into strong headwinds, and some reversal looks likely.
1st June 2021 13:54
by John Burford from interactive investor
The stock has run into strong headwinds, and some reversal looks likely.

One of the greatest challenges for traders and investors alike is deciding when to take profits on a position trade. As is often said, it is an easy matter to enter a position but difficult getting out, especially when you have racked up large gains. All kinds of strong emotions are usually involved.
Most will cling on even tighter as their share price rises, as that helps confirms their wise decision to buy. And when the market inevitable falls back, that 'buy-and-hold' mentality results in riding the downturn – sometimes back to your entry or even beyond. Then, feelings of regret emerge that you failed to take profits near the high when you had the chance. And hindsight cannot alter that decision!
Some old pros begin every day asking: if I were a neutral observer, is my share at a price where I would buy, sell or hold it?
So I will today suggest that it is prudent to begin taking at least some profits in Lloyds (LSE:LLOY) in the days ahead.
Briefly, I took a contrarian bullish stance in Lloyds (and Barclays (LSE:BARC)) about a year ago following the 2020 coronavirus market crash. I believed the selling had been overdone and the UK banks were in line for bumper results as the economic shock effects of the pandemic were likely to be short-lived.
- Interview: Richard Hunter discusses the UK banking sector
- UK retail banks start to outshine their European rivals
- Read more of our articles on UK shares
And little did I know the housing market (for mortgages) would stage such a stunning surge, boosting the shares of the retail banks.
Lloyds posted a low of 21p in September last year, and has now reached a recovery high of 50p for a gain of 140%. But it has moved into major chart resistance on huge momentum – and to me, that is an amber warning signal.
This is the weekly chart and shows the market has moved up into the area of the pink chart resistance (shades of the FTSE chart I have been posting?):
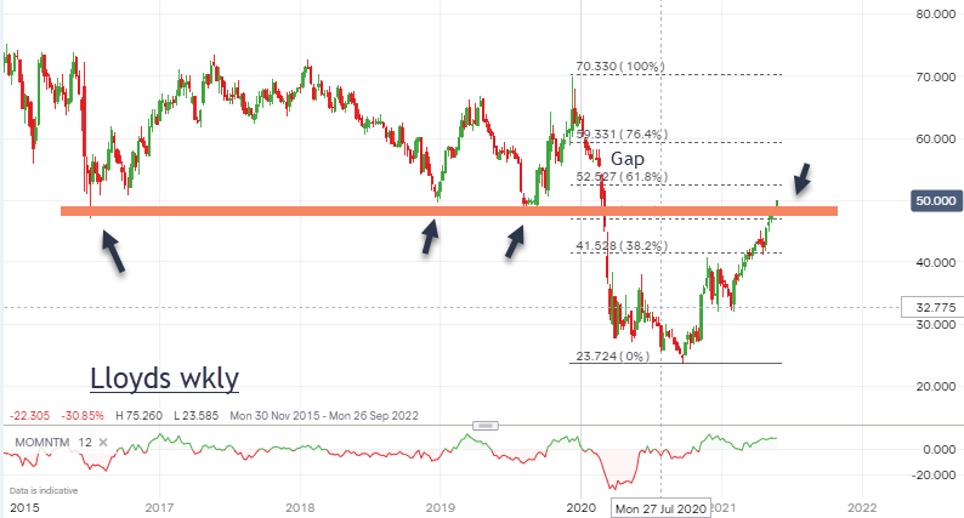
Past performance is not a guide to future performance.
The arrows on the left depict three important lows and the current position – all at the 50p region.
Meeting the area of the three previous chart points implies this area is in a potentially serious resistance zone.
Adding to this is the important Fibonacci 62% level just ahead at the 52p mark and also the downward gap of February 2020.
Closing that gap at the 55p level – a normal event – would suggest the market would then retreat off that level, as is customary.
The other bearish clue is the entire recovery has the appearance of a three-wave pattern – and these are always corrective to the one larger trend (down).
Another potential negative is the upcoming phasing out of the furlough and mortgage interest relief schemes.
- Are you saving enough for retirement? Our calculator can help you find out
- Read more about behavioural finance
At present, there seems near-unanimous agreement that the UK economy is about to bounce back very strongly. But if that falls short in some way, the disappointment would be reflected in severe share declines.
All in all, I believe I have made a solid case that the shares are now encountering strong headwinds and that a reversal down most likely lies straight ahead and that serious consideration to taking at least some profits could be made. At the very least, a dip from my 50p–55p target area should produce a move down to the 36p region.
John Burford is the author of the definitive text on his trading method, Tramline Trading. He is also a freelance contributor and not a direct employee of interactive investor.
These articles are provided for information purposes only. Occasionally, an opinion about whether to buy or sell a specific investment may be provided by third parties. The content is not intended to be a personal recommendation to buy or sell any financial instrument or product, or to adopt any investment strategy as it is not provided based on an assessment of your investing knowledge and experience, your financial situation or your investment objectives. The value of your investments, and the income derived from them, may go down as well as up. You may not get back all the money that you invest. The investments referred to in this article may not be suitable for all investors, and if in doubt, an investor should seek advice from a qualified investment adviser.
Full performance can be found on the company or index summary page on the interactive investor website. Simply click on the company's or index name highlighted in the article.
Disclosure
We use a combination of fundamental and technical analysis in forming our view as to the valuation and prospects of an investment. Where relevant we have set out those particular matters we think are important in the above article, but further detail can be found here.
Please note that our article on this investment should not be considered to be a regular publication.
Details of all recommendations issued by ii during the previous 12-month period can be found here.
ii adheres to a strict code of conduct. Contributors may hold shares or have other interests in companies included in these portfolios, which could create a conflict of interests. Contributors intending to write about any financial instruments in which they have an interest are required to disclose such interest to ii and in the article itself. ii will at all times consider whether such interest impairs the objectivity of the recommendation.
In addition, individuals involved in the production of investment articles are subject to a personal account dealing restriction, which prevents them from placing a transaction in the specified instrument(s) for a period before and for five working days after such publication. This is to avoid personal interests conflicting with the interests of the recipients of those investment articles.