Chart of the week: Market slumps, but we pick a winner
This tip is already up 15% in only five weeks and the shares have just confirmed the bullish stance.
9th December 2019 11:02
by John Burford from interactive investor
This tip is already up 15% in only five weeks and the shares have just confirmed the bullish stance.

Marks and Spencer may be coming back from the dead now
I am updating my coverage of this totally bombed-out share as a real-time commentary on the progress of one of my major contrarian forecasts for Chart of the week where I have attempted to do what the vast majority of pundits say is impossible – and that is, to pick a major bottom (or top) prior to a large swing. I am at present doing just that in my COTWs of McDonalds.
Of course, this strategy is totally at odds with the stern admonition not to trade against the trend. That appears in all introductory lessons in stock market investing. But recall the old saw – to break the rules, first you must understand them.
I maintain that it is perfectly possible to nail tops and bottoms with excellent timing in many circumstances by using a combination of my Tramline methods and an estimate of market sentiment. As I pointed out in my first coverage of Marks & Spencer (LSE:MKS) on 4 November, it is when sentiment is extremely bearish that bottoms are made.
So why bother doing this? For two major reasons. First, if you can get on board a major swing at the start, your profits will be maximised. But the other reason – and perhaps more important – is that at a major low, you can set a close stop loss where your risk of loss is the lowest possible.
If you do what almost everyone else does and enter a trade part of the way along a wave, your risk of loss is much greater since pull-backs are often encountered and your stop loss is much more vulnerable. So, in fact, my strategy is lower risk, contrary to common belief (but the scariest to implement!).
Here is the long-term weekly chart for M&S that I showed in November:
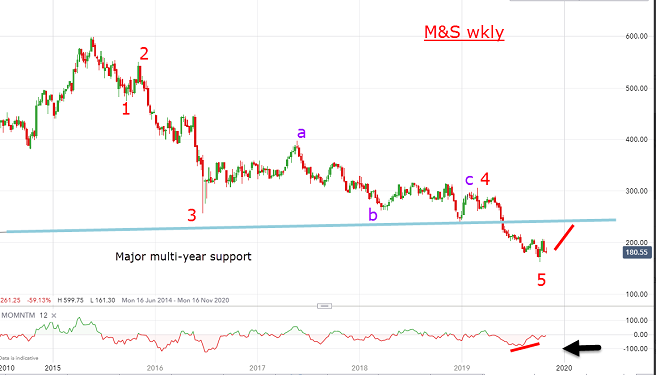
Source: interactive investor Past performance is not a guide to future performance
I noted the potentially complete wave structure at £1.62 on 10th October as my final fifth wave. Remember, that was a 19-year low. The critical momentum divergence there told me that selling pressure was drying up and a move to the blue support/resistance line around £2.40 was on the cards with higher potential.
This is what I concluded last month when the shares traded at £1.80:
“The bottom line: I am warming to M&S as a trade and/or investment. Only a drop below the wave 5 low at £1.62 would send me back to the drawing board.”
Since then, sentiment has soured even more with anti-M&S headlines. But did the shares collapse further?
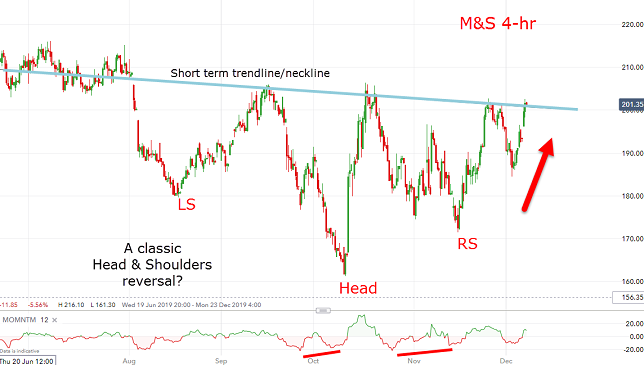
Source: interactive investor Past performance is not a guide to future performance
Not exactly. In fact, it is forming a classic Head & Shoulders reversal pattern with the market at the current £2 level testing the neckline. And a thrust above it would confirm my bullish stance with my first target at the £2.40 area. Note the key momentum divergence at the Head at the £1.62 low.
The market totally ignored the ‘bearish’ Daily Mail article and powered 20% higher last week in what some would call a ‘perverted’ move. It’s funny, but when such a seeming contrary move occurs, it is safe to acknowledge there are larger forces at work.
When the shares have moved up, that is when the pundits ‘discover’ the story behind the advance. By then it may be time to take profits, of course.
The bottom line: My November forecast is on track and only a move below the £1.62 low would give me cause to rescind it.
Monday Flash: I see the open this morning has taken the shares above my neckline to help confirm my bullish stance.
For more information about Tramline Traders, or to take a three-week free trial, go to www.tramlinetraders.com.
John Burford is the author of the definitive text on his trading method, Tramline Trading. He is also a freelance contributor and not a direct employee of interactive investor.
These articles are provided for information purposes only. Occasionally, an opinion about whether to buy or sell a specific investment may be provided by third parties. The content is not intended to be a personal recommendation to buy or sell any financial instrument or product, or to adopt any investment strategy as it is not provided based on an assessment of your investing knowledge and experience, your financial situation or your investment objectives. The value of your investments, and the income derived from them, may go down as well as up. You may not get back all the money that you invest. The investments referred to in this article may not be suitable for all investors, and if in doubt, an investor should seek advice from a qualified investment adviser.
Full performance can be found on the company or index summary page on the interactive investor website. Simply click on the company's or index name highlighted in the article.
Disclosure
We use a combination of fundamental and technical analysis in forming our view as to the valuation and prospects of an investment. Where relevant we have set out those particular matters we think are important in the above article, but further detail can be found here.
Please note that our article on this investment should not be considered to be a regular publication.
Details of all recommendations issued by ii during the previous 12-month period can be found here.
ii adheres to a strict code of conduct. Contributors may hold shares or have other interests in companies included in these portfolios, which could create a conflict of interests. Contributors intending to write about any financial instruments in which they have an interest are required to disclose such interest to ii and in the article itself. ii will at all times consider whether such interest impairs the objectivity of the recommendation.
In addition, individuals involved in the production of investment articles are subject to a personal account dealing restriction, which prevents them from placing a transaction in the specified instrument(s) for a period before and for five working days after such publication. This is to avoid personal interests conflicting with the interests of the recipients of those investment articles.