Chart of the week: the oil majors spring to life
The oil price bucked the consensus for a downwards slide – but what comes next?
14th December 2020 14:02
by John Burford from interactive investor
The oil price bucked the market consensus of a continued downwards slide – but what comes next?

In my article of 19 October I made a strong case for buying shares in oil stocks BP (LSE:BP.) and Royal Dutch Shell (LSE:RDSB). My chart analysis and sentiment reading led me to that conclusion, which was a highly contrarian stance. Market consensus had the oil price sliding in the face of reducing demand, with oil company shares following.
But since financial market prices do not follow the mainstream ‘fundamental’ economic cause-and-effect model (as most believe), there was a very strong case to be made for the oil price to actually improve. And with bearish sentiment in full flow, any surprises were likely to be to the upside. That is precisely what happened.
This was the weekly chart of BP I showed in October:
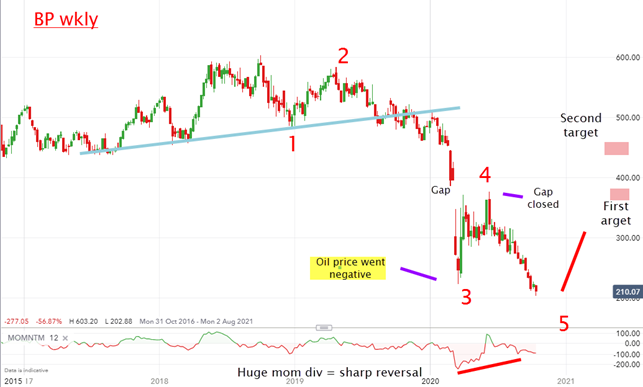
Source: interactive investor. Past performance is not a guide to future performance.
This is what I wrote:
“If I am correct, we may have here one of the best opportunities to pick up shares in class companies with modest downside risk, if any. I am adding them to my buy low/sell high list. My first target is around £3.50.”
- The ETFs Show: investing in oil, gold and other commodities
- FTSE 100 predicted to boom on back of Brexit trade talks
The share price was trading around the £2 region, as it was making new lows. The fifth wave had already done enough to consider the five down pattern complete. It not only made a new low below the wave three low, but there was a mammoth momentum divergence staring us in the face. How could I ignore that?
In fact, the £2 mark was the actual bottom, as the shares moved up briskly from 19 October as the crude oil price advanced. Here is the updated action on the daily chart:
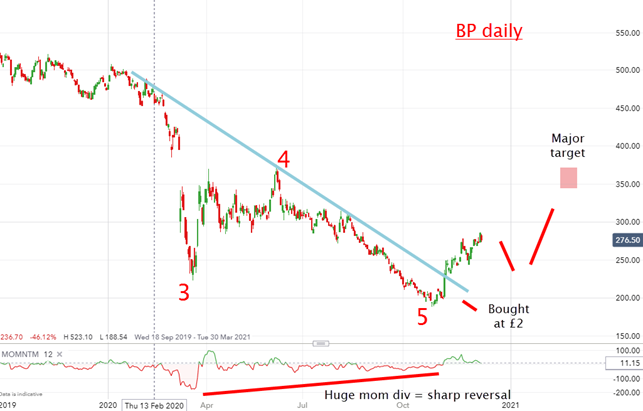
Source: interactive investor. Past performance is not a guide to future performance.
It has now advanced to the £2.80 area, where it enters overhead resistance. Odds are that it should now experience a dip before renewing the uptrend towards my £3.50 target area.
Short-term traders eyeing a 40% gain may well be looking to take some profits here, with a view to re-instating positions on any dip. Longer-term holders/investors will hold, as they have a potential ‘whale’ trade as they performed one of my ‘buy low/sell high operations.
- What does a no-deal Brexit mean for interest rates and dividends?
- Are you saving enough for retirement? Our calculator can help you find out
Note that my October call broke one of the golden rules of investing: Never try to time tops and bottoms. Most equity pundits proclaim it is impossible to time these, so it is best to wait for a trend to become established and join that. These ‘experts’ obviously have never studied basic charting techniques.
The obvious counter is that is yes, it is possible to pick them, and with low risk. If you wait for an obvious trend it is likely over by then!
For more information about Tramline Traders, or to take a three-week free trial, go to www.tramlinetraders.com.
John Burford is the author of the definitive text on his trading method, Tramline Trading. He is also a freelance contributor and not a direct employee of interactive investor.
These articles are provided for information purposes only. Occasionally, an opinion about whether to buy or sell a specific investment may be provided by third parties. The content is not intended to be a personal recommendation to buy or sell any financial instrument or product, or to adopt any investment strategy as it is not provided based on an assessment of your investing knowledge and experience, your financial situation or your investment objectives. The value of your investments, and the income derived from them, may go down as well as up. You may not get back all the money that you invest. The investments referred to in this article may not be suitable for all investors, and if in doubt, an investor should seek advice from a qualified investment adviser.
Full performance can be found on the company or index summary page on the interactive investor website. Simply click on the company's or index name highlighted in the article.
Disclosure
We use a combination of fundamental and technical analysis in forming our view as to the valuation and prospects of an investment. Where relevant we have set out those particular matters we think are important in the above article, but further detail can be found here.
Please note that our article on this investment should not be considered to be a regular publication.
Details of all recommendations issued by ii during the previous 12-month period can be found here.
ii adheres to a strict code of conduct. Contributors may hold shares or have other interests in companies included in these portfolios, which could create a conflict of interests. Contributors intending to write about any financial instruments in which they have an interest are required to disclose such interest to ii and in the article itself. ii will at all times consider whether such interest impairs the objectivity of the recommendation.
In addition, individuals involved in the production of investment articles are subject to a personal account dealing restriction, which prevents them from placing a transaction in the specified instrument(s) for a period before and for five working days after such publication. This is to avoid personal interests conflicting with the interests of the recipients of those investment articles.