Chart of the week: a pattern that chartists love
What does this chart pattern, which often heralds a decent pull-back, mean for Google-owner Alphabet?
20th July 2020 10:16
by John Burford from interactive investor
This chart pattern often heralds a decent pull-back, so our analyst looks at what this might mean for Google-owner Alphabet.

Is the mania for the FAANG gang wavering?
Three weeks ago, I asked if the FAANGs (Facebook (NASDAQ:FB), Amazon (NASDAQ:AMZN), Apple (NASDAQ:AAPL), Netflix (NASDAQ:NFLX), Google (NASDAQ:GOOGL)) were losing their teeth. They have been the way-out-ahead leaders of the pack for some time, with a large part of the advances in the S&P and Nasdaq being generated by this small band.
But as no tree grows to the sky, I made my case that the end of the exponential rallies was very likely nigh. And last week, I pointed to Tesla (NASDAQ:TSLA) and its manic bull run that was likely near its exhaustion. As it happened, on the date of publication – Monday – a major high was attained at $1,800. Currently, the stock is trading at $1,486 for a drop of 17% off the high in four days. Nice timing!
And now we have another crack in the edifice of the FAANG gang mania, with Netflix currently down $100 (also 17% please note). So, are the pins being toppled one-by-one?
- Chart of the week: the future for Tesla shares
- Chart of the week: are the FAANGS finally losing their teeth?
Today, I am looking at Alphabet (aka Google) which shows some very interesting features on its chart. Here is the weekly chart going back to 2017.
I have drawn a blue trendline which started in 2014 that joins up the major highs:
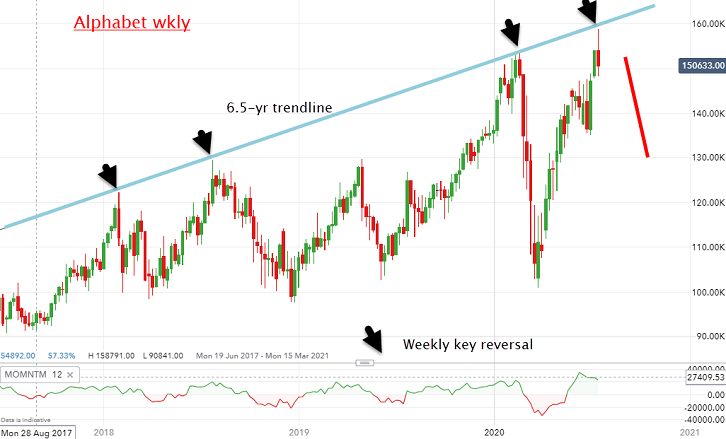
Source: interactive investor. Past performance is not a guide to future performance.
It has been in a major bull market since inception, and it is a brave/foolish person to call a top after such a stunning one-way advance. The bears have been crushed, so far (unless they traded the Corona Crash, of course).
The price chart shows that Alphabet shares have surged to a new high every time, then backed off quite sharply before staging another advance into a new high. This is the result of investors employing a ‘Buy the Dip’ strategy that has been highly publicised.
But note that every time (in the last four previous major highs), there has been a weekly key reversal. This is a weekly price bar where the shares made a new all-time high, then sold off during that week and closed the week below the low of the previous week. Chartists love this pattern because it often heralds a decent pull-back (the last one in March was especially admirable!)
It seems that weekly key reversals mark buying exhaustions, where the dwindling buying pressure is not enough to prevent the selling to take over.
One day the pattern of ‘news highs, dips and then another new all-time high’ will be broken – and that will occur when most least expect it.
If a titanic Wall of Worry created by a global pandemic cannot stop the steamroller bull that is the FAANG gang, what can?
I have a feeling we will find out pretty soon.
For more information about Tramline Traders, or to take a three-week free trial, go to www.tramlinetraders.com.
John Burford is the author of the definitive text on his trading method, Tramline Trading. He is also a freelance contributor and not a direct employee of interactive investor.
These articles are provided for information purposes only. Occasionally, an opinion about whether to buy or sell a specific investment may be provided by third parties. The content is not intended to be a personal recommendation to buy or sell any financial instrument or product, or to adopt any investment strategy as it is not provided based on an assessment of your investing knowledge and experience, your financial situation or your investment objectives. The value of your investments, and the income derived from them, may go down as well as up. You may not get back all the money that you invest. The investments referred to in this article may not be suitable for all investors, and if in doubt, an investor should seek advice from a qualified investment adviser.
Full performance can be found on the company or index summary page on the interactive investor website. Simply click on the company's or index name highlighted in the article.
Disclosure
We use a combination of fundamental and technical analysis in forming our view as to the valuation and prospects of an investment. Where relevant we have set out those particular matters we think are important in the above article, but further detail can be found here.
Please note that our article on this investment should not be considered to be a regular publication.
Details of all recommendations issued by ii during the previous 12-month period can be found here.
ii adheres to a strict code of conduct. Contributors may hold shares or have other interests in companies included in these portfolios, which could create a conflict of interests. Contributors intending to write about any financial instruments in which they have an interest are required to disclose such interest to ii and in the article itself. ii will at all times consider whether such interest impairs the objectivity of the recommendation.
In addition, individuals involved in the production of investment articles are subject to a personal account dealing restriction, which prevents them from placing a transaction in the specified instrument(s) for a period before and for five working days after such publication. This is to avoid personal interests conflicting with the interests of the recipients of those investment articles.