Chart of the week: a reason to buy this bargain AIM share
29th December 2021 11:41
by John Burford from interactive investor
‘The art of good timing is to discover value just before anyone else,’ so the saying goes. Our technical analyst believes this big-shot stock fits the bill.

Is ASOS a buy at these depressed levels?
It is customary at this time of the year for analysts to offer their insights into what they see in the year ahead for shares. But I will go off-piste today with a candidate for my Buy Low/Sell High list. Regular readers will know that I like to discover shares in good businesses that have fallen on hard times (hopefully temporarily) and are poised for a re-rating by investors.
Not only that, but I like to get my timing as close to the start of that re-rating as possible with the use of my Tramline methods using chart analysis (and sentiment).
As one wise investor said: “The art of good timing is to discover value just before anyone else”.
- Lee Wild's AIM share for 2022
- Five AIM share tips for 2022
- Watch our Christmas and New Year share tips here and subscribe to the ii YouTube channel for free
This is in the tradition of the well-established ‘Buy the Dip’ school of investing. One of the many advantages of this strategy is that if our timing is good, your risk of loss is reasonably low and your holding will be in profit quickly. I happen to spend a great deal of time finding points on the charts where my odds of success are high compared with the risk. I cannot claim to get it 100% right every time but that is the normal risk of investing provided you cut losses short.
As one of the most prominent UK online fashion and beauty suppliers, ASOS (LSE:ASC) has endured the usual rapid rise when it was the new kid on the block, but then ran into the inevitable hurdles to rapid growth that beset most online businesses these days (with supply bottlenecks being the latest culprit).
The October departure of the CEO amid the supply chain chaos and the profit warning didn't help sentiment a bit and the shares continued their descent off the March highs. In fact, the shares have lost a chunky 2/3 to the recent low. Ouch!
But is the business basically sound and can the supply issues be ironed out?
Of course, the quality of the management will be sorely tested as we head into a new year and if the effects of the pandemic are to be mitigated, the outlook for the shares appears positive at these levels.
This is the weekly long-range chart showing the carnage:
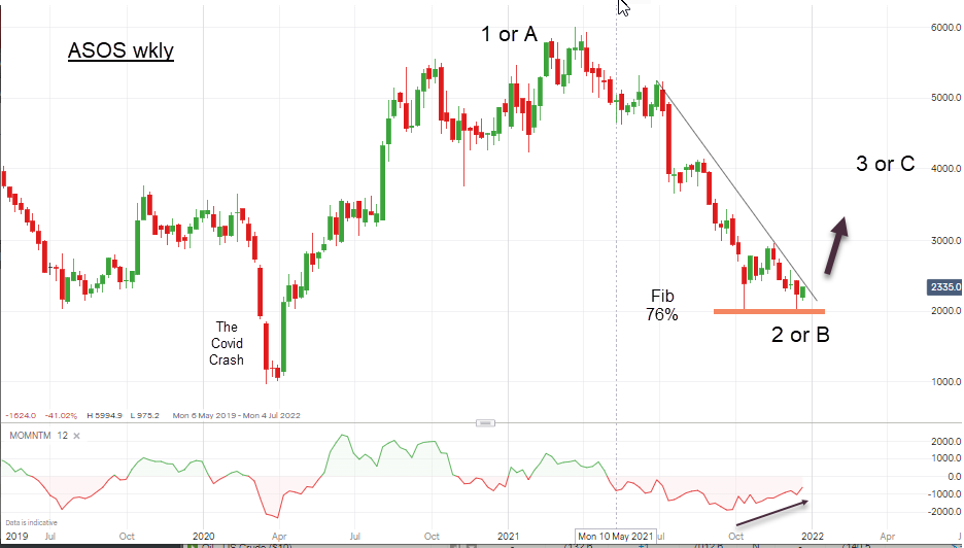
Past performance is not a guide to future performance.
Two significant features stand out. First, the shares have descended to the important Fib 76% support level of the wave up off the Corona/Covid Crash lows of last year. And second, there is a huge momentum divergence at the recent low.
Recall, a divergence in the momentum as new lows are made indicates that the selling pressure has been tailing off into the low to where the buying pressure and selling pressure are in balance.
- AIM’s best and worst shares of 2021
- Friends & Family: ii customers can give up to 5 people a free subscription to ii, for just £5 a month extra. Learn more
- Take control of your retirement planning with our award-winning, low-cost Self-Invested Personal Pension (SIPP)
This then gives the buyers a good chance they can push the shares up off the lows – and force more buyers to come in and also to effect a squeeze on the shorts. And thus a budding bounce can turn into a good rally. That is how markets make major trend reversals and it is a universal rule.
If the rally has legs, the good news starts to flow (it is always gloom and doom right at the lows).
Thus, with the shares at the current £23 area they have come off the 16 December spike low at £19.70*, I am adding them to my Buy Low/Sell High list. Only an unexpected move below £19.70 would send me back to the drawing board.
*incorrect spike low figure changed from £16.20 to £19.70 on 31 December.
John Burford is a freelance contributor and not a direct employee of interactive investor.
Disclosure
We use a combination of fundamental and technical analysis in forming our view as to the valuation and prospects of an investment. Where relevant we have set out those particular matters we think are important in the above article, but further detail can be found here.
Please note that our article on this investment should not be considered to be a regular publication.
Details of all recommendations issued by ii during the previous 12-month period can be found here.
ii adheres to a strict code of conduct. Contributors may hold shares or have other interests in companies included in these portfolios, which could create a conflict of interests. Contributors intending to write about any financial instruments in which they have an interest are required to disclose such interest to ii and in the article itself. ii will at all times consider whether such interest impairs the objectivity of the recommendation.
In addition, individuals involved in the production of investment articles are subject to a personal account dealing restriction, which prevents them from placing a transaction in the specified instrument(s) for a period before and for five working days after such publication. This is to avoid personal interests conflicting with the interests of the recipients of those investment articles.
These articles are provided for information purposes only. Occasionally, an opinion about whether to buy or sell a specific investment may be provided by third parties. The content is not intended to be a personal recommendation to buy or sell any financial instrument or product, or to adopt any investment strategy as it is not provided based on an assessment of your investing knowledge and experience, your financial situation or your investment objectives. The value of your investments, and the income derived from them, may go down as well as up. You may not get back all the money that you invest. The investments referred to in this article may not be suitable for all investors, and if in doubt, an investor should seek advice from a qualified investment adviser.
Full performance can be found on the company or index summary page on the interactive investor website. Simply click on the company's or index name highlighted in the article.