Chart of the week: is Shell’s share price rally on borrowed time?
After a spectacular and rapid recovery, our chartist discusses whether the next move will be up or down.
20th April 2020 11:41
by John Burford from interactive investor
After a spectacular and rapid recovery, our chartist discusses whether the next move will be up or down.

Shell has rallied a stunning 66% but is there more to go?
I last covered this share on 23 March on the very same day that the FTSE 100 index made its crash low at 4,898.
The latter has since recovered as high as 5,894 – a gain of a cool 1,000 pts (20%). And Royal Dutch Shell (LSE:RDSB) has moved off its £9 low made on that date to the recent high of £15 for a stunning advance of £6 (66%) in only four weeks.
And these rallies have occurred on a major sentiment boost from the deep despair last month that produced selling climaxes. In Shell’s case, the US crude oil price had collapsed from $65 at the start of the year to the March low at $23 – a savage cut of 66%.
- Chart of the week: New forecasts for oil, Tesla and Shell
- Investing in oil: prices, dividends, shale firms, and stock tips
- Commodities outlook: why oil price won’t rise after OPEC+ deal
No wonder we have seen relief rallies this month – but have they exhausted themselves and laid the groundwork for a fresh plunge to new lows?
This is what I wrote on that important 23 March low point: “It has just made a new 20-year low under £10. The wave labels are pretty clear – we are in a very extended third wave down.
When it terminates, I expect a bounce in wave 4 and then move to new lows in wave 5 with crude oil moving possibly to the $12 range.”
And from that exact date, the bounce in wave 4 got started, and this is my updated chart showing the wave 4 in progress:
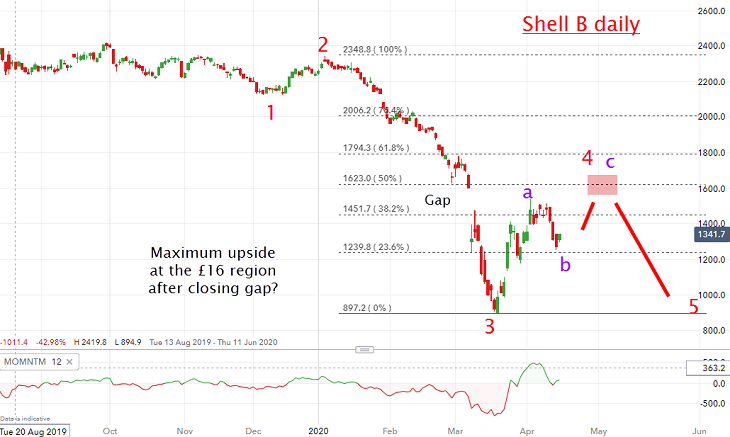
Source: interactive investor Past performance is not a guide to future performance
The first rally phase (in my ‘a’ wave) took Shell shares into the gap created on the way down.
An interesting feature of gaps is that they are usually closed eventually when in a move of the opposite direction. And when they are closed, they often move away in the opposite direction.
Gaps act somewhat like magnets to draw the market to them – and then repels it. And this action certainly fills the bill in that respect. So, the rally phase could have been over at that point. The market did certainly retreat in my ‘b’ wave where it currently resides.
But the whole pattern would look best if we saw one more rally in wave ‘c’ to really close the gap and test the Fibonacci 50% retrace of the decline from the 2020 high to March low at the £16 area. But I am perfectly at ease if the decline resumes this week.
That means the rally is on borrowed time.
Of course, much will depend on whether crude oil prices can get up off the floor or if it will sink to new lows right away. Here is my dilemma:
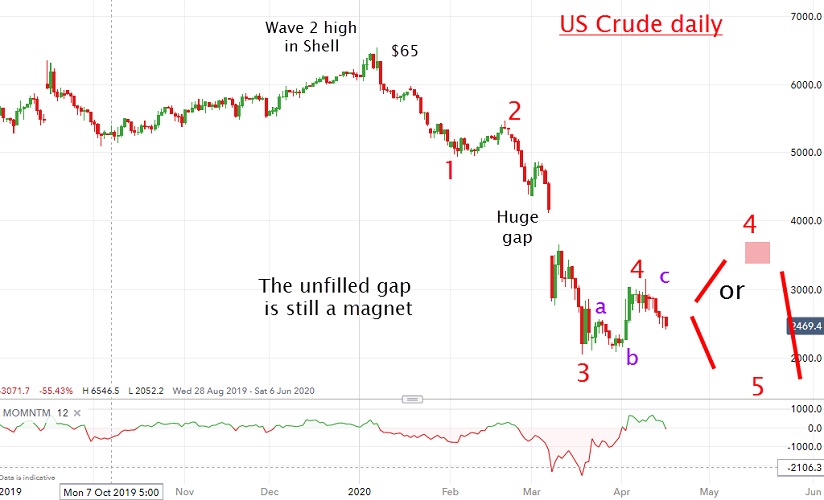
Source: interactive investor Past performance is not a guide to future performance
We are in the wave 4 up that may have topped, or will do so with one more push up to the gap edge around the $36 area (currently $25). The jury is out on that.
But I would take any additional advance towards my £16 target for Shell shares as an opportunity to take quick profits if I had bought near the £9 low last month, or to lighten up longer-term holdings.
For more information about Tramline Traders, or to take a three-week free trial, go to www.tramlinetraders.com.
John Burford is the author of the definitive text on his trading method, Tramline Trading. He is also a freelance contributor and not a direct employee of interactive investor.
These articles are provided for information purposes only. Occasionally, an opinion about whether to buy or sell a specific investment may be provided by third parties. The content is not intended to be a personal recommendation to buy or sell any financial instrument or product, or to adopt any investment strategy as it is not provided based on an assessment of your investing knowledge and experience, your financial situation or your investment objectives. The value of your investments, and the income derived from them, may go down as well as up. You may not get back all the money that you invest. The investments referred to in this article may not be suitable for all investors, and if in doubt, an investor should seek advice from a qualified investment adviser.
Full performance can be found on the company or index summary page on the interactive investor website. Simply click on the company's or index name highlighted in the article.
Disclosure
We use a combination of fundamental and technical analysis in forming our view as to the valuation and prospects of an investment. Where relevant we have set out those particular matters we think are important in the above article, but further detail can be found here.
Please note that our article on this investment should not be considered to be a regular publication.
Details of all recommendations issued by ii during the previous 12-month period can be found here.
ii adheres to a strict code of conduct. Contributors may hold shares or have other interests in companies included in these portfolios, which could create a conflict of interests. Contributors intending to write about any financial instruments in which they have an interest are required to disclose such interest to ii and in the article itself. ii will at all times consider whether such interest impairs the objectivity of the recommendation.
In addition, individuals involved in the production of investment articles are subject to a personal account dealing restriction, which prevents them from placing a transaction in the specified instrument(s) for a period before and for five working days after such publication. This is to avoid personal interests conflicting with the interests of the recipients of those investment articles.