Chart of the week: showtime for this cinema chain’s shares?
One of the UK’s biggest cinema chains attracts the scrutiny of our charts expert.
23rd August 2021 11:05
by John Burford from interactive investor
One of the UK’s biggest cinema chains attracts the scrutiny of our charts expert.

Cinemas have been one of the greatest business casualties of the pandemic.
They were one of the first that were forced to shut up shop – and one of the last to be allowed to re-open in a limited way.
Naturally, the shares of the major chains have been hit hard as their debts kept mounting up.
Not only that, but the streaming at-home services have gained market share during the lockdowns in a deja vu moment reminiscent of the 1950s when at-home TV was the new kid on the block to challenge the might of the cinemas for entertainment.
So, with that kind of pressure, are cinemas doomed to fade away as expensive popcorn outlets (with a ticket thrown in as an added extra)?
If the 1950s history is any guide and if the operators are just as inventive as they were 70 years ago, then there is certainly hope they will survive - and even flourish.
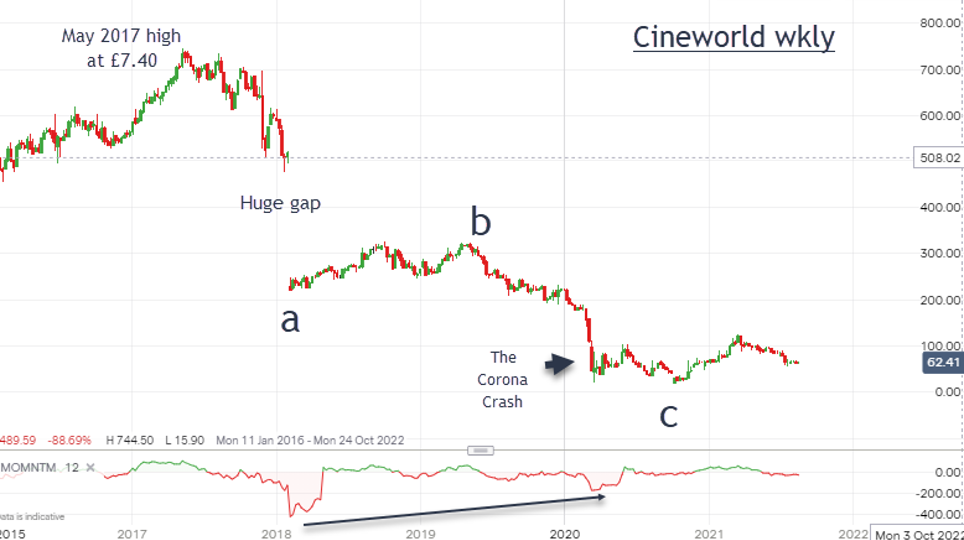
In the near term, much hangs on the future course of the pandemic going into winter. This has resulted in a collapse of the shares from the 2017 high at £7.40 to the recent low at 56p. So, is this a candidate for my Buy Low/Sell High list?
Here is the sad picture of the share price chart on the weekly:

Past performance is not a guide to future performance.
The standout feature is the huge gap lower in February 2018. Whenever I see such a large gap, I am reminded that gaps often act as magnets drawing prices back to them – given time: that is, provided the company is not heading for the scrap heap!
The gap appeared three and a half years ago and so long as the company remains viable, it remains a possible target. The upper gap edge is at the £5 region.
The entire decline off the 2017 high does have a three down look with my 'c' wave low at 56p.
Since then, they have advanced to the £1.24 high in March and then have fallen back to the Fibonacci 62% retrace.
This is a common reversal point. I am looking for a rally to start from around current levels.
So at the current 61p price, my max downside is 50p for a bullish forecast. My first upside target is the March £1.24 high.
One other factor is that AMC (NYSE:AMC) – a major competitor – had become a ‘meme’ stock and was subjected to a major short squeeze in May/June that drove the shares up seven-fold in just eight trading days.
- AMC Entertainment: what could happen to this volatile Reddit stock
- Stockwatch: this AIM Covid recovery play faces another big test
Cineworld (LSE:CINE) has a high short interest, so could history possibly repeat?
John Burford is the author of the definitive text on his trading method, Tramline Trading. He is also a freelance contributor and not a direct employee of interactive investor.
These articles are provided for information purposes only. Occasionally, an opinion about whether to buy or sell a specific investment may be provided by third parties. The content is not intended to be a personal recommendation to buy or sell any financial instrument or product, or to adopt any investment strategy as it is not provided based on an assessment of your investing knowledge and experience, your financial situation or your investment objectives. The value of your investments, and the income derived from them, may go down as well as up. You may not get back all the money that you invest. The investments referred to in this article may not be suitable for all investors, and if in doubt, an investor should seek advice from a qualified investment adviser.
Full performance can be found on the company or index summary page on the interactive investor website. Simply click on the company's or index name highlighted in the article.
Disclosure
We use a combination of fundamental and technical analysis in forming our view as to the valuation and prospects of an investment. Where relevant we have set out those particular matters we think are important in the above article, but further detail can be found here.
Please note that our article on this investment should not be considered to be a regular publication.
Details of all recommendations issued by ii during the previous 12-month period can be found here.
ii adheres to a strict code of conduct. Contributors may hold shares or have other interests in companies included in these portfolios, which could create a conflict of interests. Contributors intending to write about any financial instruments in which they have an interest are required to disclose such interest to ii and in the article itself. ii will at all times consider whether such interest impairs the objectivity of the recommendation.
In addition, individuals involved in the production of investment articles are subject to a personal account dealing restriction, which prevents them from placing a transaction in the specified instrument(s) for a period before and for five working days after such publication. This is to avoid personal interests conflicting with the interests of the recipients of those investment articles.