Chart of the week: this small-cap share could multiply in value
17th January 2022 11:30
by John Burford from interactive investor
All the elements are in place for this share to stage a strong advance in what should be a very powerful short squeeze, believes this technical analyst.

Petrofac remains on my Buy Low/Sell High list
On 27 September I covered this oil services company for COTW when the shares were trading around the 137p area. My analysis told me Petrofac (LSE:PFC) was a prime candidate for my Buy Low/Sell High list. The shares had fallen by a stunning 95% off its 2012 all-time high at £17.80 and I laid out my case that if oil could maintain its strong upward bias, the shares should recover to at least the £7 region.
- Chart of the week: is Petrofac share price boom just the beginning?
- Stockwatch: exciting times for these two shares
That was when Brent crude oil was trading at $78 and the oil major BP (LSE:BP.) was trading at £3.20. Since then, crude oil dipped hard to the $67 low and has zoomed up to the current $86 region and BP has climbed to new post-Covid highs at £3.90.
In that time, what has Petrofac been doing? In fact, it has barely moved and is trading at 148p today – barely shifting from the September print while the markets for crude (and for the oil majors) have moved up considerably.
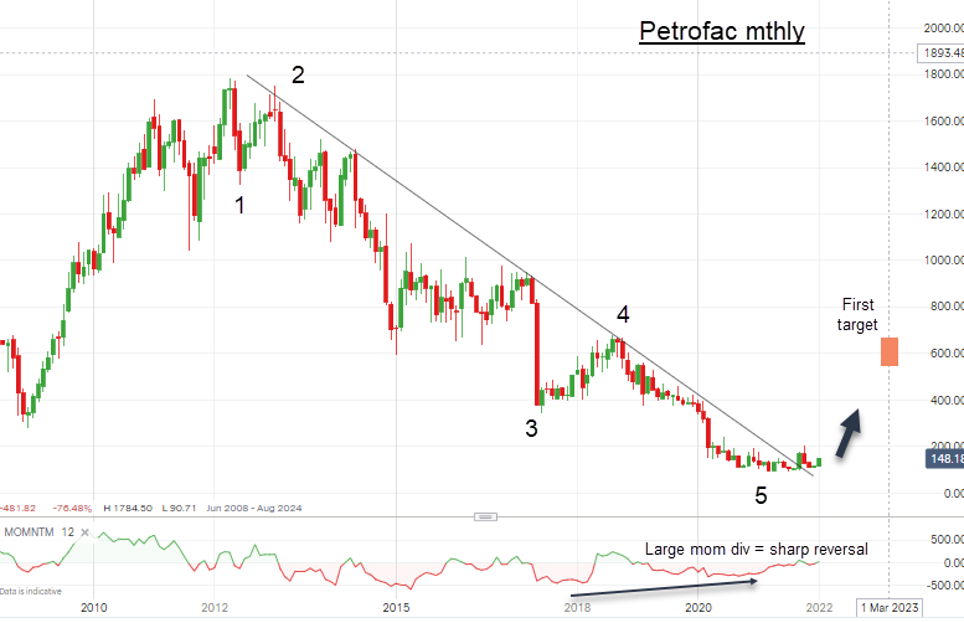
Here is my updated chart that is barely changed from that I posted in September:

Past performance is not a guide to future performance.
The large downtrend line remains but this time, the market is breaking up away from it and, with the strong momentum divergence I pointed out last time, all the elements are in place for the market to stage that strong advance in what should be a very powerful short squeeze. My first target area is £7 and then possibly £8.
There is great irony in the surging energy markets that many investors are shunning for idealogical reasons. This is what I wrote in September: “And crude oil is following a similar path. So, with rising demand along with rising prices, will there be a move to exploit these high prices by oil and gas companies increasing their exploration and development budgets? That would be the normal economic path and would be a no-brainer if many Western governments were not so committed to killing off the industry.”
- 35 small-cap stocks to own in 2022
- Best 39 growth stocks for 2022
- Friends & Family: ii customers can give up to 5 people a free subscription to ii, for just £5 a month extra. Learn more
For profit-seeking investors not so constrained by Western governments' self-destructive clamp down on fossil, the officially hated oil sector is actually outperforming the tech sector! The FTSE 100, which is dominated by oil and mining, is actually advancing while the tech-hevy Nasdaq is off 9% from its November high.
Of course, this is leading to booming input prices that are reflected in the Producer Price Index (and down the line to the Consumer Price Index) as we are seeing today.
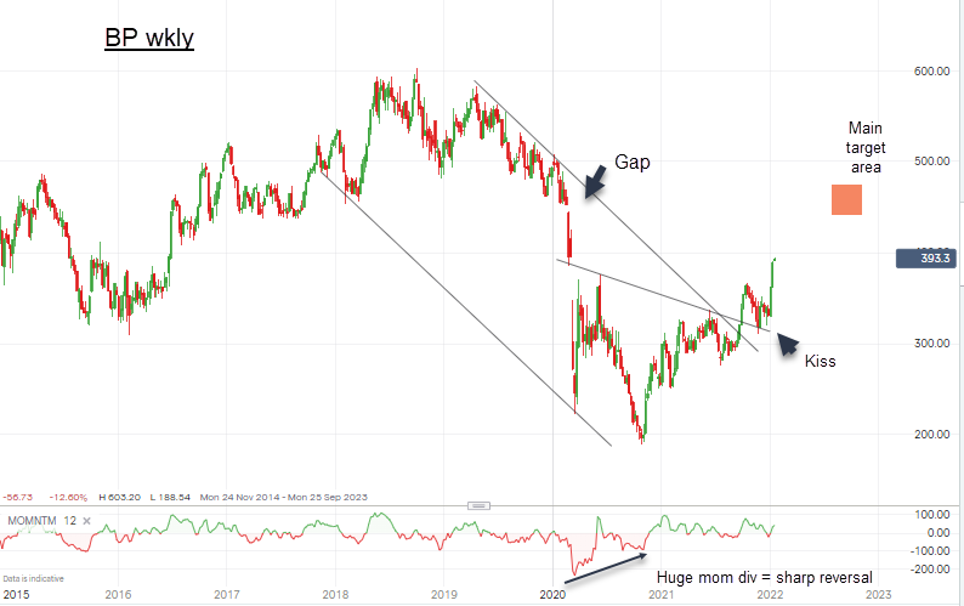
Here is BP:

Past performance is not a guide to future performance.
The stand-out feature is the huge momentum divergence at the 2020 corona crash low, which is leading to the current surge. I have a major target at the £4.50-£5.00 area.
I remain bullish on fossil.
John Burford is a freelance contributor and not a direct employee of interactive investor.
These articles are provided for information purposes only. Occasionally, an opinion about whether to buy or sell a specific investment may be provided by third parties. The content is not intended to be a personal recommendation to buy or sell any financial instrument or product, or to adopt any investment strategy as it is not provided based on an assessment of your investing knowledge and experience, your financial situation or your investment objectives. The value of your investments, and the income derived from them, may go down as well as up. You may not get back all the money that you invest. The investments referred to in this article may not be suitable for all investors, and if in doubt, an investor should seek advice from a qualified investment adviser.
Full performance can be found on the company or index summary page on the interactive investor website. Simply click on the company's or index name highlighted in the article.
Disclosure
We use a combination of fundamental and technical analysis in forming our view as to the valuation and prospects of an investment. Where relevant we have set out those particular matters we think are important in the above article, but further detail can be found here.
Please note that our article on this investment should not be considered to be a regular publication.
Details of all recommendations issued by ii during the previous 12-month period can be found here.
ii adheres to a strict code of conduct. Contributors may hold shares or have other interests in companies included in these portfolios, which could create a conflict of interests. Contributors intending to write about any financial instruments in which they have an interest are required to disclose such interest to ii and in the article itself. ii will at all times consider whether such interest impairs the objectivity of the recommendation.
In addition, individuals involved in the production of investment articles are subject to a personal account dealing restriction, which prevents them from placing a transaction in the specified instrument(s) for a period before and for five working days after such publication. This is to avoid personal interests conflicting with the interests of the recipients of those investment articles.