Chart of the week: time to buy Gamma Communications shares?
13th December 2021 11:36
by John Burford from interactive investor
Taking a slightly different approach this week, technical analyst John Burford has found an AIM stock he believes has limited downside and greater upside potential.

I am veering a little off-piste this week with this AIM-listed UK communications company. I normally avoid the smaller caps unless it meets a few important criteria. Gamma Communications (LSE:GAMA) offers communications solutions for small- and medium-sized companies and operates overseas as well as in the UK. It has seen some solid earnings growth data already but that has slowed recently.
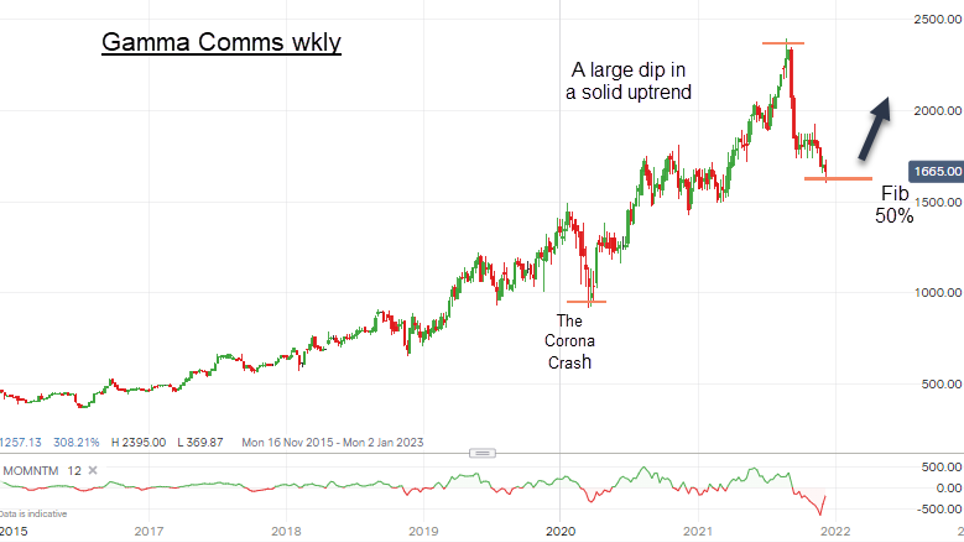
The shares have had a somewhat roller-coaster ride (a typical path for small tech caps) but, at current valuations, it offers solid upside potential. The chart below is a textbook example of what I mean with downside seeming limited with greater upside potential.
Past performance is not a guide to future performance.
It has rallied from the early days around £5 to the all-time high of £24 posted last August and, since then, the market has retreated to the current £16-£17 range.
But note that this price lies at the Fibonacci 50% retrace of the entire rally off the Corona Crash low back in March 2020 – where many reversals are made. I believe that is a significant milestone.
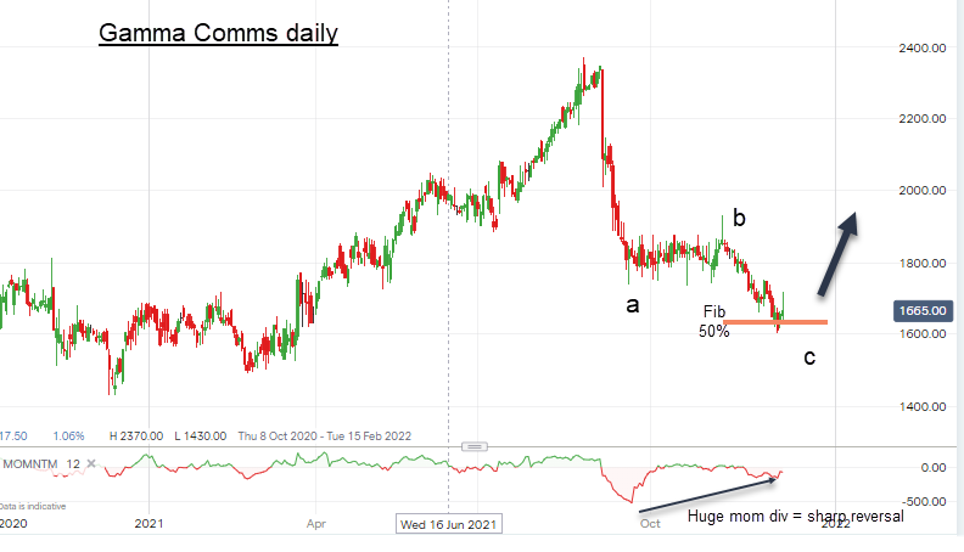
Here is the daily chart:
Past performance is not a guide to future performance.
It also shows the decline off the all-time high has a clear three-down look to a huge momentum divergence at the 'c' wave low.
If this is indeed the low of the correction, then I expect a vigorous reversal consistent with the message that the momentum divergence represents a gradual shift from the dominant selling pressure to dominant buying.
Not only that but the current market is dipping into the solid chart support zone from July 2020 to April 2021. That is a lengthy period of consolidation and, provided an advance can start from around here, the bounce out of it should be strong.
- Should investors be CIRCUMSPECT in 2022?
- Subscribe to the ii YouTube channel for interviews with popular investors
Of course, the correction could dip a little further to the £14.50 Fibonacci 62% region from the current £16.50, which could occur if sentiment towards tech takes a major turn for the worse (which I view as unlikely in the near to medium term).
A reasonable first major target is the £24 record, with higher potential. Any hard decline below £14.50 would send me back to my drawing board.
John Burford is the author of the definitive text on his trading method, Tramline Trading. He is also a freelance contributor and not a direct employee of interactive investor.
These articles are provided for information purposes only. Occasionally, an opinion about whether to buy or sell a specific investment may be provided by third parties. The content is not intended to be a personal recommendation to buy or sell any financial instrument or product, or to adopt any investment strategy as it is not provided based on an assessment of your investing knowledge and experience, your financial situation or your investment objectives. The value of your investments, and the income derived from them, may go down as well as up. You may not get back all the money that you invest. The investments referred to in this article may not be suitable for all investors, and if in doubt, an investor should seek advice from a qualified investment adviser.
Full performance can be found on the company or index summary page on the interactive investor website. Simply click on the company's or index name highlighted in the article.
Disclosure
We use a combination of fundamental and technical analysis in forming our view as to the valuation and prospects of an investment. Where relevant we have set out those particular matters we think are important in the above article, but further detail can be found here.
Please note that our article on this investment should not be considered to be a regular publication.
Details of all recommendations issued by ii during the previous 12-month period can be found here.
ii adheres to a strict code of conduct. Contributors may hold shares or have other interests in companies included in these portfolios, which could create a conflict of interests. Contributors intending to write about any financial instruments in which they have an interest are required to disclose such interest to ii and in the article itself. ii will at all times consider whether such interest impairs the objectivity of the recommendation.
In addition, individuals involved in the production of investment articles are subject to a personal account dealing restriction, which prevents them from placing a transaction in the specified instrument(s) for a period before and for five working days after such publication. This is to avoid personal interests conflicting with the interests of the recipients of those investment articles.