Chart of the Week: war or no war, the FTSE is heading lower
14th February 2022 11:14
by John Burford from interactive investor
With US tech leading the way lower, technical analyst John Burford, considers investors' options.
In November, the peak of investors' love affair with big name US tech shares occurred – as I forecast at the time in my posts and videos here. And since then, many of the market-leading FAANGs have crashed with Meta (NASDAQ:FB) off by 40% and Netflix (NASDAQ:NFLX) by 50%. Even the Teflon Apple (NASDAQ:AAPL) is losing altitude.
But what is astonishing me is that this disaster has barely had a mention in the mainstream media. Maybe they will sit up and take notice if/when the darling Apple declines 10% or more. It seems that investors are totally OK with this rapid loss of value in their portfolios. Evidently, most believe this is just another dip to buy and all shares will recover again (as they always had). No need to panic – just follow the usual advice and hold tight – or even buy more.
But what a dangerous assumption! A perma-bull mentality has prevented most observers disallowing any thoughts of a major new bear market that is just getting under way. Perish the thought.
But with the macro picture throwing up massive headwinds in the form of rising bond yields and central banks finally responding to the escalating price inflation all around, can the share market climb that Everest-like Wall of Worry?
- US stock market outlook 2022: more record highs for Wall Street?
- Meta’s share crash wipes $200 billion off valuation
- Stockwatch: should you copy Fundsmith and buy this FAANG stock?
Remember when the state of Austria issued a never-before-imagined 100-year bond and investors climbed over themselves to snap them up? Well, they have actually halved in value since December 2020. So much for the portfolio balance theory.
And remember when 10-year Greek bonds were yielding 0.55% with investors snapping them up? Today the yield is over 2.6% - a jump of 372% and a loss in the bond price of about 80%. Ouch. All is not well in the Land of the Bonds as the bond vigilantes have proved themselves once again much smarter than the stock guys.
And one data point stood out for me last week. It was the revelation that the inflow of funds into US equities was the largest on record ever from both retail and professional investors. Yes, the Pavlovian 'Buy the Dip' impetus is alive and well even as the market sinks.
On Friday afternoon, shares sank hard as the Ukraine picture darkened, with crude oil jumping to an eight-year high. So much for the much-promised cheap energy from wind and solar.
- A guide on how investors can protect against inflation
- Friends & Family: ii customers can give up to 5 people a free subscription to ii, for just £5 a month extra. Learn more
Thus with US tech leading the way lower, what can an investor do other than hang tight (or sell now?). Remember, I flagged the likely top in tech in October/November and advised taking at least some profits then. With most pundits keeping a bullish outlook, is it too late to abandon the bull and embrace the bear?
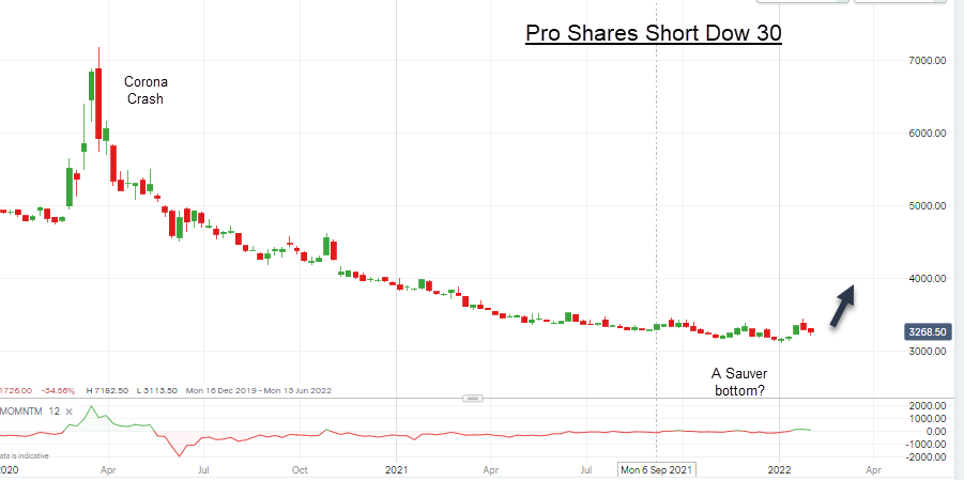
One investment that would benefit greatly from any US share price declines is a short stock index ETF. There are many out there and here is one of the largest and most liquid – ProShares Short Dow 30 ETF (not currently available to trade on the ii platform).
Past performance is not a guide to future performance.
If we have reached bottom (top in the index), then a moderate 50% retrace to the Corona crash high would set a target at 52 from the current 32 point – a gain of 62%. And if we really are in a major bear market, then much higher targets are likely.
UK investors could buy as a hedge against FTSE declines, as the indexes would more or less track each other in a declining phase. But to my mind, lightening up seems a prudent policy.
John Burford is a freelance contributor and not a direct employee of interactive investor.
These articles are provided for information purposes only. Occasionally, an opinion about whether to buy or sell a specific investment may be provided by third parties. The content is not intended to be a personal recommendation to buy or sell any financial instrument or product, or to adopt any investment strategy as it is not provided based on an assessment of your investing knowledge and experience, your financial situation or your investment objectives. The value of your investments, and the income derived from them, may go down as well as up. You may not get back all the money that you invest. The investments referred to in this article may not be suitable for all investors, and if in doubt, an investor should seek advice from a qualified investment adviser.
Full performance can be found on the company or index summary page on the interactive investor website. Simply click on the company's or index name highlighted in the article.
Disclosure
We use a combination of fundamental and technical analysis in forming our view as to the valuation and prospects of an investment. Where relevant we have set out those particular matters we think are important in the above article, but further detail can be found here.
Please note that our article on this investment should not be considered to be a regular publication.
Details of all recommendations issued by ii during the previous 12-month period can be found here.
ii adheres to a strict code of conduct. Contributors may hold shares or have other interests in companies included in these portfolios, which could create a conflict of interests. Contributors intending to write about any financial instruments in which they have an interest are required to disclose such interest to ii and in the article itself. ii will at all times consider whether such interest impairs the objectivity of the recommendation.
In addition, individuals involved in the production of investment articles are subject to a personal account dealing restriction, which prevents them from placing a transaction in the specified instrument(s) for a period before and for five working days after such publication. This is to avoid personal interests conflicting with the interests of the recipients of those investment articles.